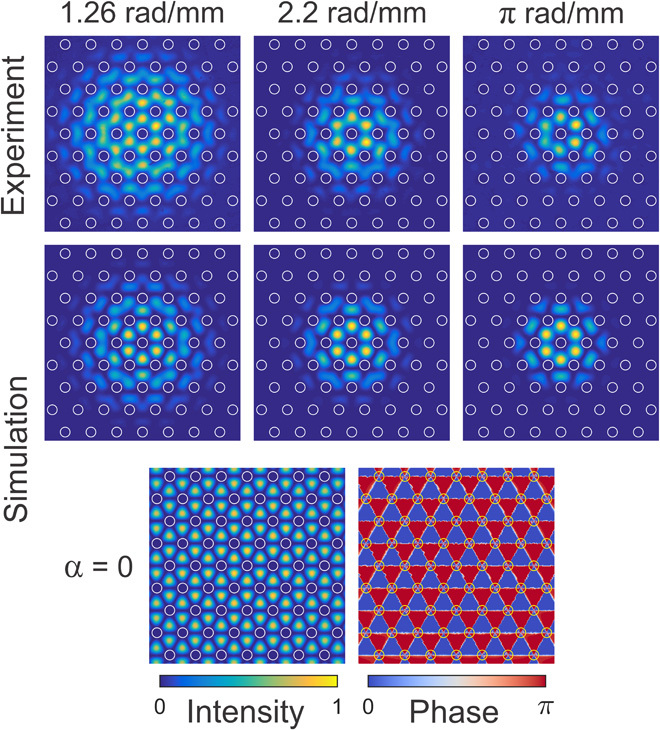
Fig. 3. Experimental (upper) and calculated (middle) axial Poynting vector distributions at a wavelength of 818 nm for twist rates 1.26, 2.20, and π rad/mm.

The locations of the hollow channels are marked with white circles. The two lower plots show the calculated axial Poynting vector (left) and phase (right) distributions at the bottom of the passband in the untwisted case, when there is no bound mode.
