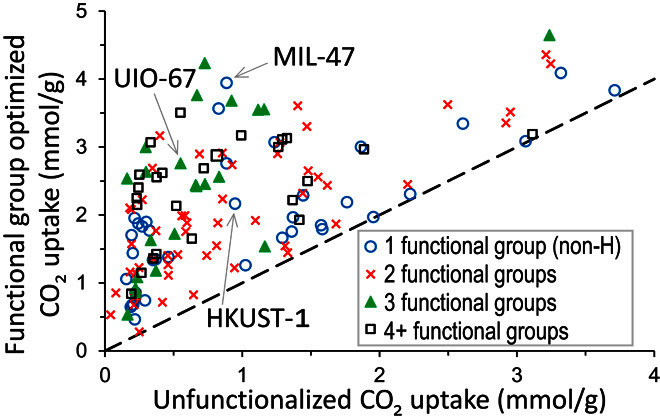
Fig. 3. MOFF-GA results on experimental MOF.

CO2 uptake at 0.15 atm and 298 K for 141 experimentally characterized MOFs whose functional groups have been optimized with MOFF-GA compared to the uptake of the unfunctionalized parent MOF (dashed line). Data point symbols denote the number of unique, nonhydrogen functional groups in the best structure.
