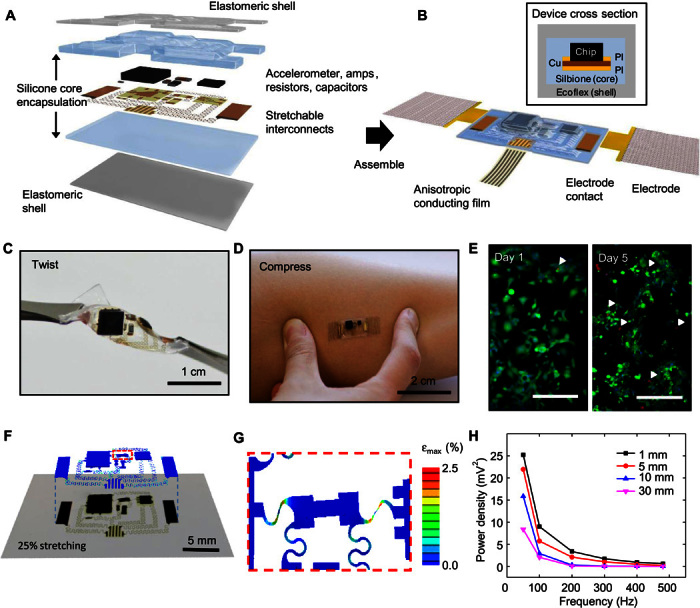
Fig. 1. Schematic illustration of an epidermal mechano-acoustic–electrophysiological measurement device.

(A) Exploded view diagram of the overall design structure of the system. (B) Illustration of the assembled device and its interface with soft EP measurement electrodes and flexible cable for power supply and data acquisition. A cross-sectional view appears in the upper inset. (C) Device held by tweezers in a twisted configuration. (D) Device mounted on skin while compressed by pinching. (E) Fluorescence micrographs of cells cultured on the surface of a device to illustrate its biocompatibility. Green and red regions correspond to live and dead cells, respectively. The white arrowheads highlight the latter. Scale bars, 200 μm. (F) Overlay of optical image and finite element simulation results for a device under biaxial stretching to a strain of 25%. (G) Magnified view of modeling results for the part of the interconnect structures that experiences the highest strain. (H) Vibrational response summarized in a plot of spectral power measured while mounted on a layer of chicken breast, to simulate tissue, on a vibration source.
