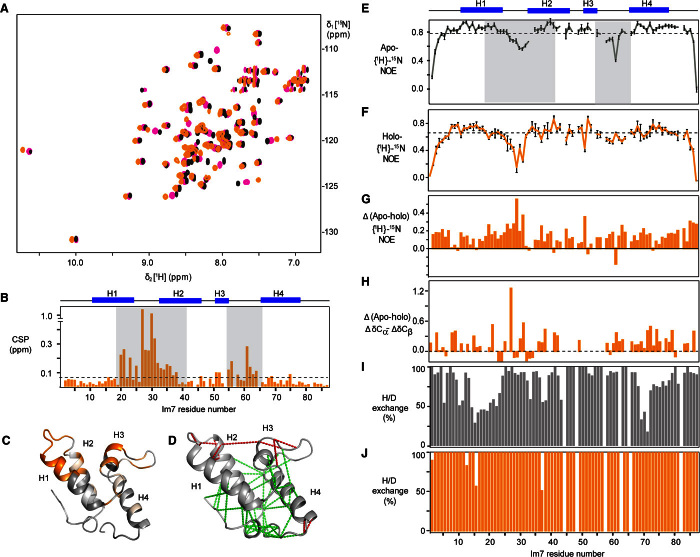
Fig. 2. Recognition sites and dynamics of the client Im7 upon binding Spy.
(A) Two-dimensional [15N,1H]-HSQC (heteronuclear single-quantum coherence) spectra of 200 μM Im7 titrated with increasing concentration of Spy: 0 (black), 60 (magenta), and 240 μM (orange). (B) Weighted average CSPs of amide moieties plotted against the amino acid residue number of 200 μM Im7 upon interaction with 240 μM dimeric Spy. The secondary structure of Im7 is indicated on top. Gray shades denote the strongest interacting segments. (C) Projection of the CSPs of WT Im7 upon binding with Spy on the crystal structure of Im7 [from Protein Data Bank ID code 1AYI (39)]. A gray-to-orange color scale is applied according to the magnitude of the CSPs for the interaction with Spy. The brightest orange indicates the largest CSP. (D) Local frustration of Im7 is depicted on its crystal structure (39). Clusters of maximum and minimum frustrated contacts are shown by red and green dash lines, respectively. (E and F) Plots of 15N-{1H} heteronuclear NOE of apo Im7 (green) and holo Im7 (orange). (G) The subtraction of the 15N-{1H} heteronuclear NOE of apo Im7 with the 15N-{1H} heteronuclear NOE of holo Im7. (H) Cα-Cβ secondary chemical shift deviation changes between apo and holo forms of Im7. (I and J) Percentage of the amide protons of the apo (I) and holo forms (J) of Im7 that exchanged with deuterium within 3 min.

