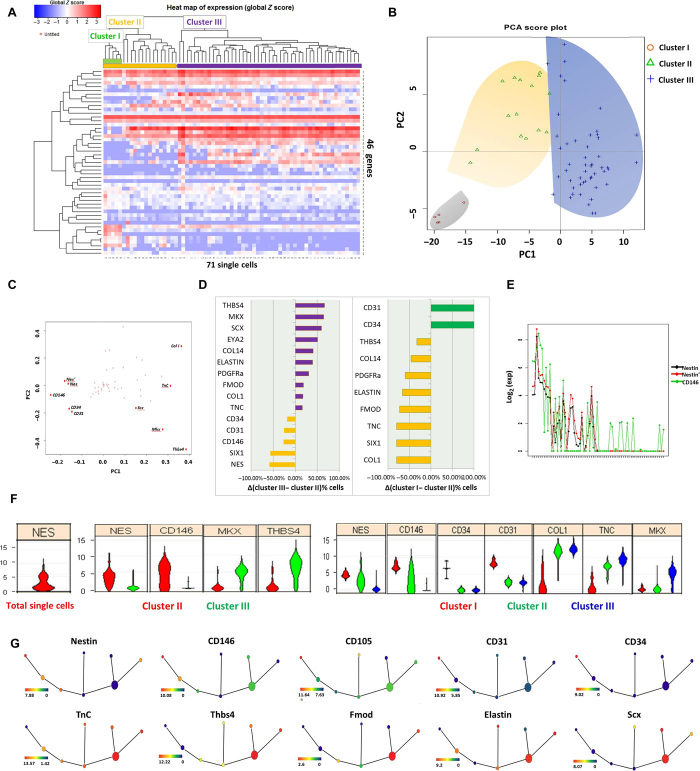
Fig. 1. Single-cell transcriptional profiling reveals distinct subpopulations of tendon cells and their corresponding markers.
(A) Heat map showing that the unbiased HC well separates the single-cell gene expression profiles of 71 individual cells isolated by the C1 system and analyzed for expression of 46 gene transcripts by qRT-PCR. Top colored bars indicate clusters identified as clusters I (green), II (orange), and III (purple). (B) PCA of the full qRT-PCR results of 71 tendon-derived cells. Each dot represents a cell, colored according to its subpopulation as determined by HC. Cells are plotted against the first two PCs. (C) Genes projected onto the first two PC loadings. (D) Different genes with expression that was on or off in each group (cluster II/cluster III and cluster I/remainder of cluster II). The proportion differences of cells between clusters II and III, in descending order from top to bottom, are shown. Purple indicates genes that are overrepresented in cells of cluster III. Orange indicates genes that are overrepresented in cells of cluster II. Green represents genes that are overrepresented in cells of cluster I. (E) Correlation analysis of nestin (NES). (F) Violin plots represent expression of a number of genes (fold change above background) in individual cells. (G) SPADE from single-cell expression pattern of 46 genes. Overlaid expression patterns of different genes contribute in defining distinct cell populations.

