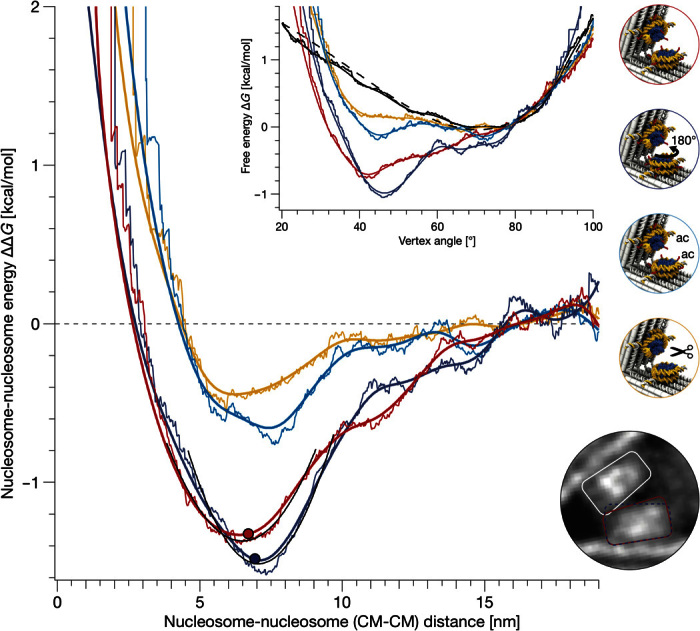
Fig. 4. Energy landscapes for nucleosome pair interactions.

Normal and uniform kernel density estimates (thick versus thin lines; kernel density bandwidth of 3°) of the nucleosome-nucleosome interaction energy landscapes plotted as a function of the distance between the nucleosome centers of mass (CM; computed from 3MVD.pdb using Cα-atoms for histones and C4′-atoms for nucleosomal DNA). Red versus dark blue lines, wild-type nucleosomes, oriented such that the dyad axis encloses an angle of 78° or 258° (Fig. 3, B and C, respectively). The dots mark the first steric clashes of the nucleosomes. Cyan lines, nucleosomes with acetylated histone H4; orange lines, nucleosomes lacking all N-terminal histone tails. Inset: The combined free-energy landscapes of nucleosome and force spectrometer (red, dark blue, cyan, and orange) plotted versus the measured opening angle, which were obtained from the angle distributions (Fig. 3) by taking the logarithm (note S8). Solid black lines, the free-energy landscape of the bare spectrometer; dashed line, free energy of the fitted force spectrometer model (note S3). Top right: Schematics indicating sample details. Border color refers to the corresponding energy landscape. Bottom right: Zoom into the average single-particle micrograph obtained from force spectrometers having vertex angles within the range of 36° to 41° and wild-type nucleosomes as in Fig. 3B. Lines schematically depict the trapezoidal shapes of the nucleosome. Red versus blue indicates samples as in the main panel. The onset of clashes depends on the relative orientation of the nucleosomes (see fig. S13 for additional average single-particle micrographs).
