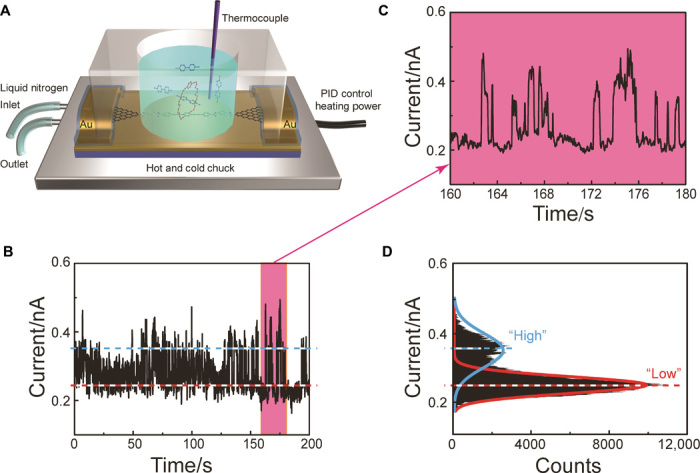
Fig. 2. Schematic representation and electrical characterization of SMJs at the device-liquid interface.

(A) Schematic illustration of the SMJ device-liquid interface characterization platform. The SMJ device was set onto a hot and cold chuck (silver) and further loaded with a PDMS reservoir (transparent). PID, proportion-integration-differentiation. (B) I-t curve of BPP34C10-SMJ immersed in a Me2SO solution of 1 mM MV·2PF6 at room temperature for 200 s with a sampling rate of 28.8 kSa/s. (C) Partial I-t curve of (B) (160 to 180 s). (D) Histogram of (B), showing a bimodal current distribution (Vbias = 100 mV).
