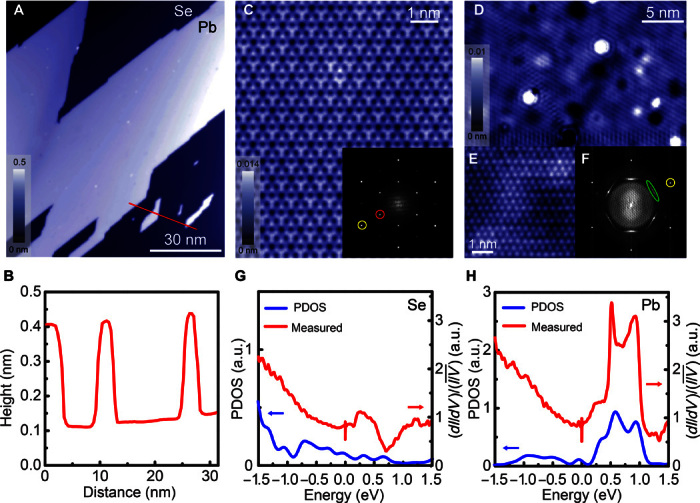
Fig. 2. Topographic images and tunneling spectra.

(A) Topography of PbTaSe2 showing atomically flat terraces and step edges (V = 100 mV and I = 2 pA). (B) The height profile deduced from the red line in (A). (C) The atomic-resolution topographic image on the Se-terminated surface (V = 10 mV and I = 300 pA). The inset shows the fast Fourier transform (FFT) of this topographic image. Yellow and red circles indicate the position of Bragg peaks and the peak of the 2 × 2 superstructure, respectively. (D) Topography on the Pb-terminated surface (V = 10 mV and I = 100 pA) shows strong LDOS modulation from QPI of TSSs. (E) The atomic-resolution topographic image on the Pb-terminated surface (V = −10 mV and I = 300 pA). (F) FFT of the topographic image in (D). Bragg peaks are marked by a yellow circle, and the dispersive signals from QPI are observed (green ellipse). The normalized tunneling spectrum and calculated partial density of states (PDOS) on (G) Se-terminated and (H) Pb-terminated surfaces, respectively (T = 0.26 K, V = 800 mV, I = 1 nA, and lock-in modulation = 0.5 mV). The superconducting gap near EF is not resolved clearly because of the large modulation in lock-in measurements. a.u., arbitrary units.
