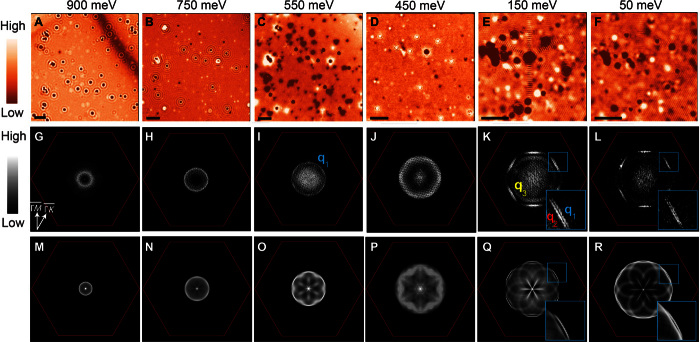
Fig. 3. Visualization of QPI on a Pb-terminated surface.
(A to F) A sequence of normalized differential conductance dI/dV(r, E) maps taken at normal state (T = 6 K). The field of view (FOV) of each image is adjusted to access the region of interest in q space. A larger FOV is required at higher energy near the Dirac point to resolve the smaller q vector. Scale bar, 10 nm (in each image). (G to L) The corresponding FFT of normalized dI/dV(r, E) maps taken in (A) to (F). (M to R) The simulated QPI images at the corresponding energy considering two topological surface bands, with band structures shown in Fig. 1F (details in note S4).

