
Fig. 4. Energy dispersion of topological surface bands by QPI.
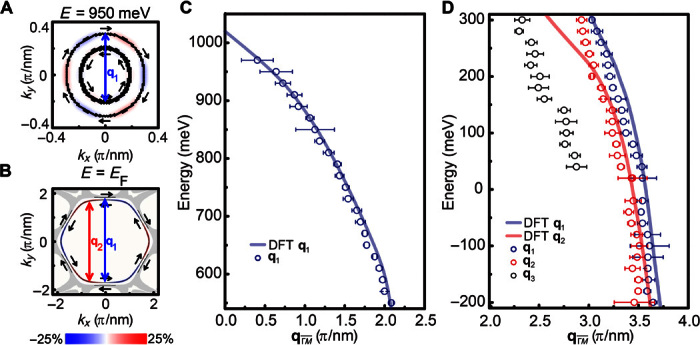
The calculated constant energy contours (CECs) of two TSSs with spin texture at (A) E = 950 meV and (B) EF. The black arrows represent the in-plane spin direction, and the blue/red contours show the sign and the magnitude of out-of-plane spin. The color scale indicates the ratio of out-of-plane spin to total spin polarization. The blue and red arrows in each image indicate the relation between topological surface bands with scattering vectors q1 and q2, respectively. The seemingly Rashba surface states are due to the unusual dispersion of the Dirac cone in Fig. 1F, in which the outer and inner CECs (upper and lower parts of the Dirac cone) exist at the same energy. The outer TSS and the bulk state strongly overlap below E ~ 300 meV around [gray regions in (B)], leaving a small portion near EF. The energy dispersion of (C) q1 from E = 500 meV to E = 1000 meV and (D) q1, q2, and q3 from E = −200 meV to E = 300 meV. Hollow circles are extracted from the measured QPI images along the direction, which are in agreement with the QPI dispersion obtained from our calculated topological surface band structure (solid lines). We do not extract the exact |q| in the energy range between 300 and 500 meV, in which blurry q1 occurs because of flat band dispersion and larger <Sz> in the TSS. q3 is associated with the intraband scattering on hole-like bulk bands at .