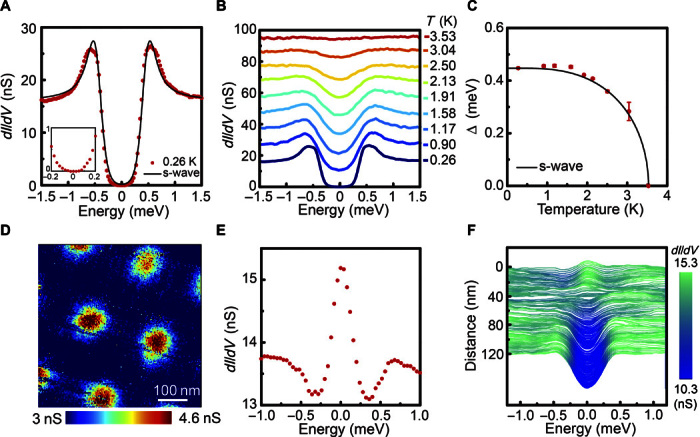
Fig. 5. Superconducting state and vortex imaging.

(A) The tunneling spectrum on the Pb-terminated surface at T = 0.26 K (V = 25 mV, I = 600 pA, and lock-in modulation = 50 μV). The black line is the result of a single BCS s-wave gap fitting (details in note S7). The inset shows the zoom-in of the spectrum between 0.2 and −0.2 meV. (B) Temperature evolution of a tunneling spectrum on the Pb-terminated surface. Each spectrum is shifted by 10 nS for clarity. (C) The temperature dependence of a superconducting gap. The black line represents the theoretical temperature dependence from the BCS theory. (D) Differential conductance map at EF shows the triangular vortex lattice, with an applied magnetic field of 0.05 T at T = 0.26 K (V = 10 mV, I = 60 pA, and lock-in modulation = 250 μV). (E) The tunneling spectrum at the vortex core shows the structure of a vortex bound state (V = 30 mV, I = 400 pA, modulation = 60 μV, applied magnetic field = 0.05 T, and T = 0.26 K). (F) The spatial dependence of a tunneling spectrum from the center of a vortex core toward the next nearest vortex core (V = 30 mV, I = 600 pA, lock-in modulation = 60 μV, applied magnetic field = 0.05 T, and T = 0.26 K).
