
Figure 4.
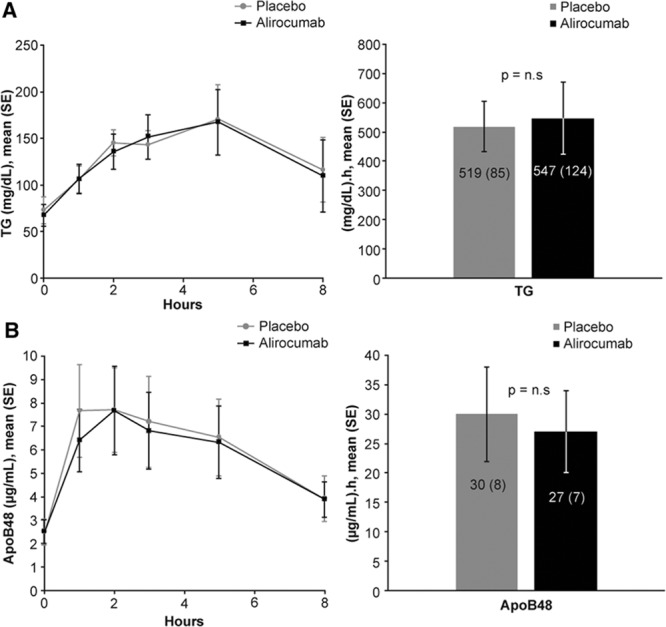
Postprandial levels of TG (A) and ApoB48 (B) after a high-fat meal. (Left) Mean concentrations over time. (Right) Incremental area-under-the-curve (IAUC). Ten participants had blood samples just before and at 1, 2, 3, 5, and 8 hours after consuming a high-fat liquid meal providing 1237 Kcal per 2 m2 body surface area from 75% fat, 10% protein, and 15% carbohydrate The data are presented as individual timepoints (mean±SE) and area under the curve above baseline (IAUC) (mean±SE) of plasma TG and apoB48 concentrations. Alirocumab had no effects on postprandial levels of TG and apoB48 compared with placebo. apoB indicates apolipoprotein B; and TG, triglycerides.