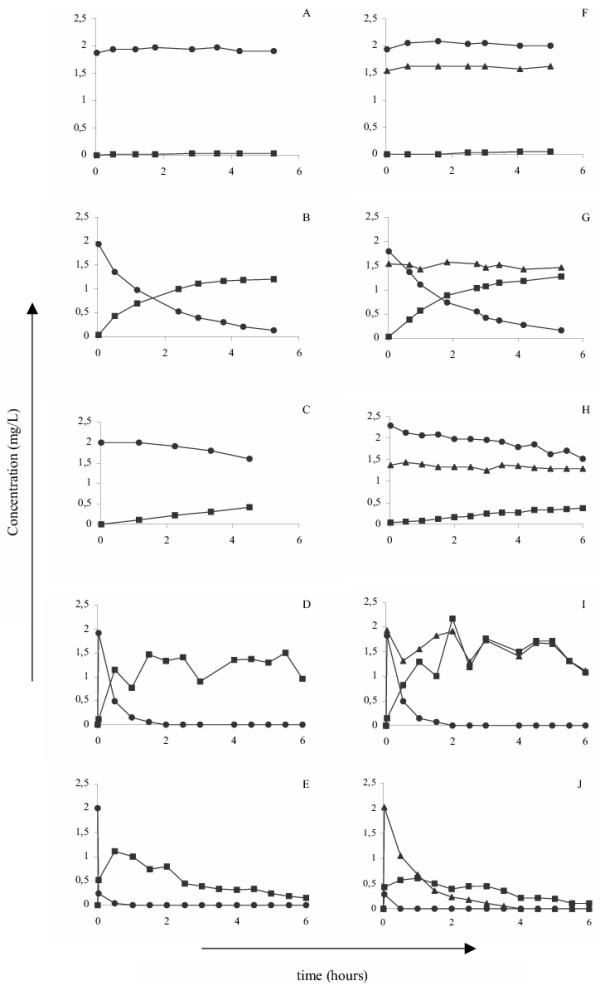
Figure 1.

Changes in the concentrations of the various FAE in different environments. DMF at a concentration of 2 mg/L or the combination of 2 mg/L DMF and 1.4 mg/L MEF were placed at 37°C in 0.1 N HCl; pH 1 (A, F), 0.1 M sodium phosphate buffer; pH 8 (B, G), 0.1 M sodium phosphate buffer; pH 7.4 (C, H), normal human serum (D, I) or whole blood (E, J). At various intervals thereafter samples were collected and the MMF (squares), DMF (circles) and MEF (triangles) concentrations were measured using HPLC. Results are a representative experiment of at least 3 independent experiments.
