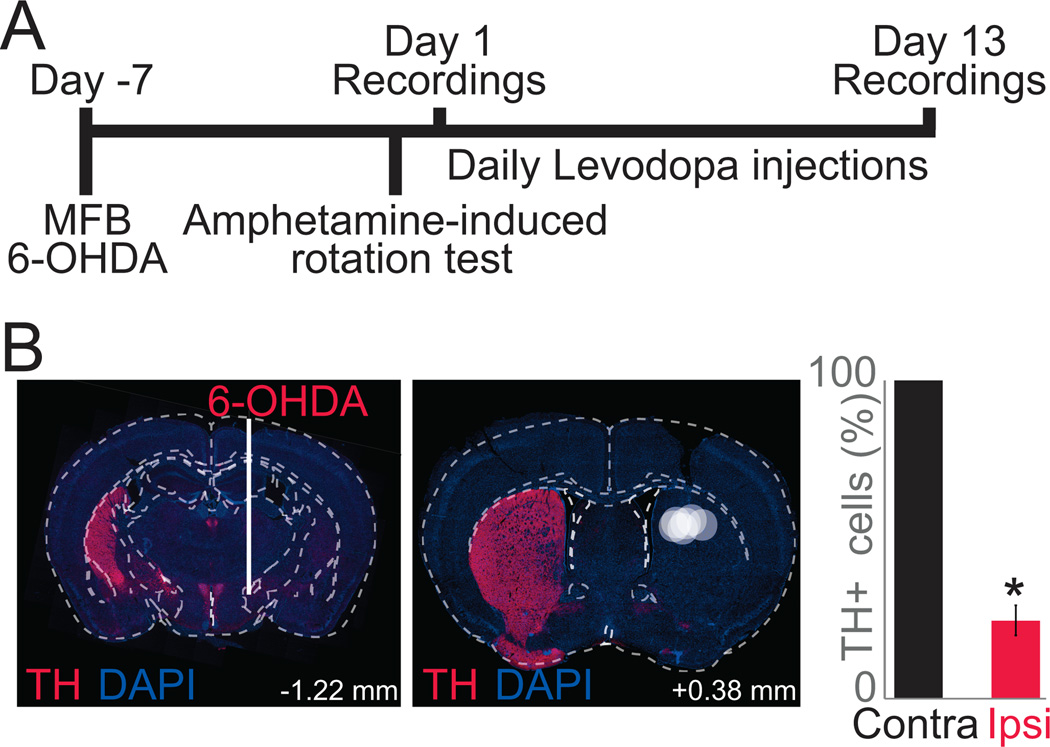
Figure 1. Experimental timeline: mouse model of levodopa-induced dyskinesias.
A) To model LIDs, we depleted dopamine unilaterally with a MFB 6-OHDA lesion and injected levodopa (20 mg/kg) for two weeks. We recorded striatal neuronal ensemble activity on Day 1 and 13 of levodopa administration. B) Location of MFB 6-OHDA lesion (left) via immunohistochemistry resulting in large loss of striatal dopamine in the dorsal striatum, where electrodes were implanted (right; TH in red; DAPI in blue). Each white circle represents electrode placement of one animal. Bar graph shows quantification of TH in the substantia nigra pars compacta. On average, animals had 71±5% less TH positive cells on the lesioned side (red) when compared to the contralateral side (black). Data from 5 lesioned mice. (*) p<0.05.

