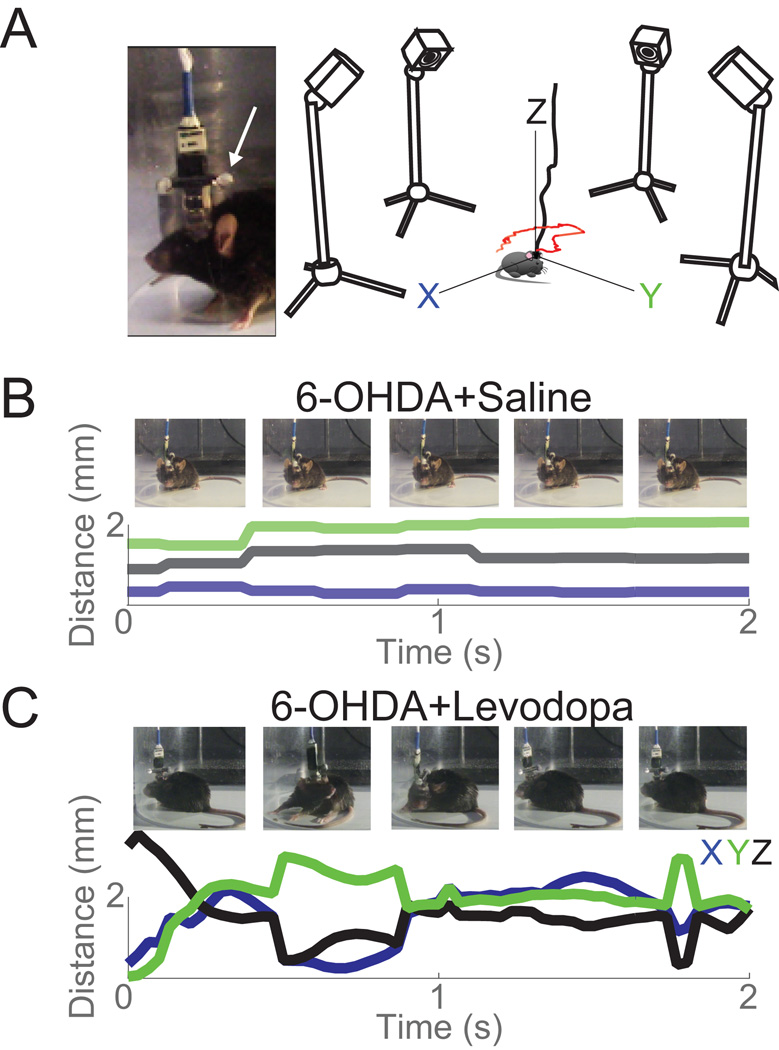
Figure 2. Tracking set-up.
A) Inset: Picture of two infrared reflective spheres (white arrow) and recording electrode. Right: Diagram of 4 infrared cameras calibrated to track movements at 120 frames/s. B) Tracking examples (2 s) in a dopamine-depleted animal (6-OHDA) in the X (blue), Y (green), and Z (black) axes with corresponding still images. C) The same animal as in (B) with initial levodopa administration in the X (blue), Y (green), and Z (black) axes with corresponding still images.

