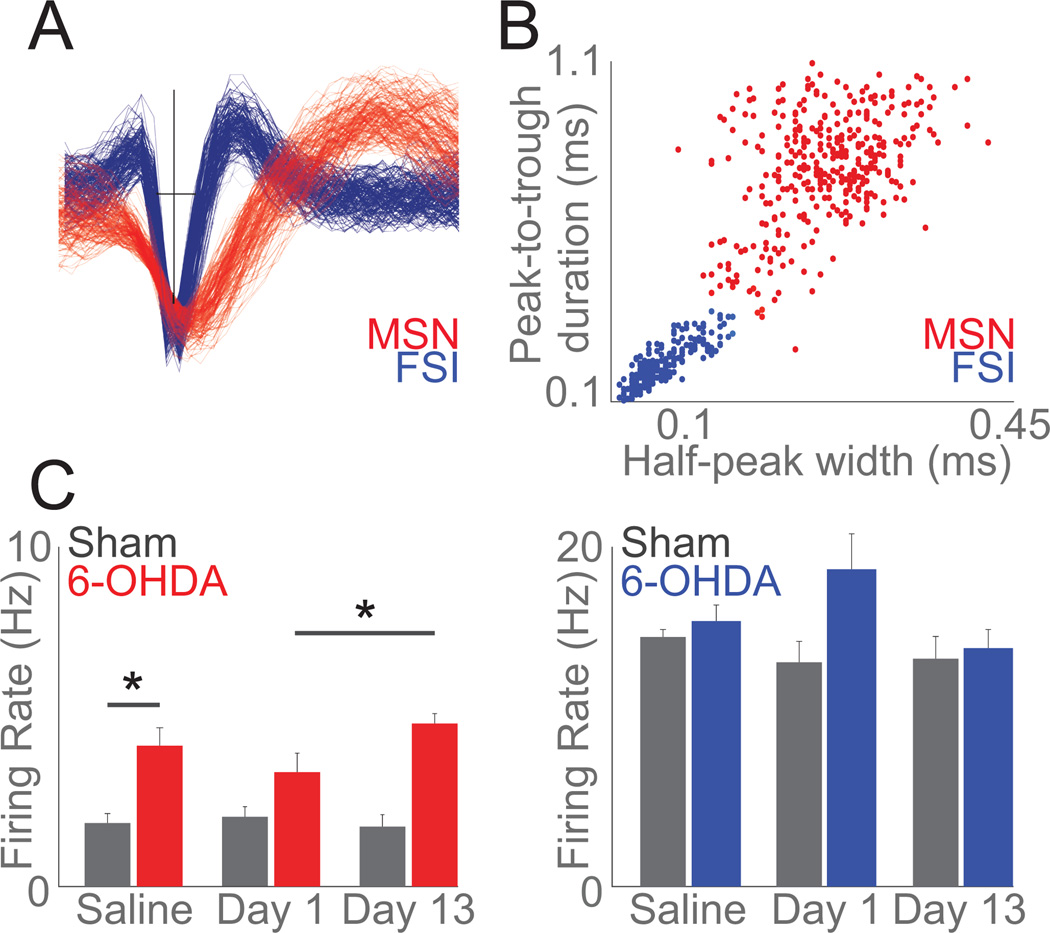
Figure 4. Striatal MSNs increase firing rate as LIDs develop.
A) Example waveforms of one MSN (red) and one FSI (blue) recorded from a single electrode. B) Clustering across peak-to-trough duration and half-peak-width identified 240 MSNs (red) and 146 FSIs (blue). C) Mean firing rate of MSNs increased following 6-OHDA lesion (Saline: sham-lesion (grey) vs 6-OHDA-lesioned in (red)) and as LIDs developed (Day 1 vs Day 13) while FSIs did not change as LIDs developed; data from 240 MSNs and 146 FSIs in 9 mice over 3 days. Error bars are mean ± SEM; (*) p<0.05.

