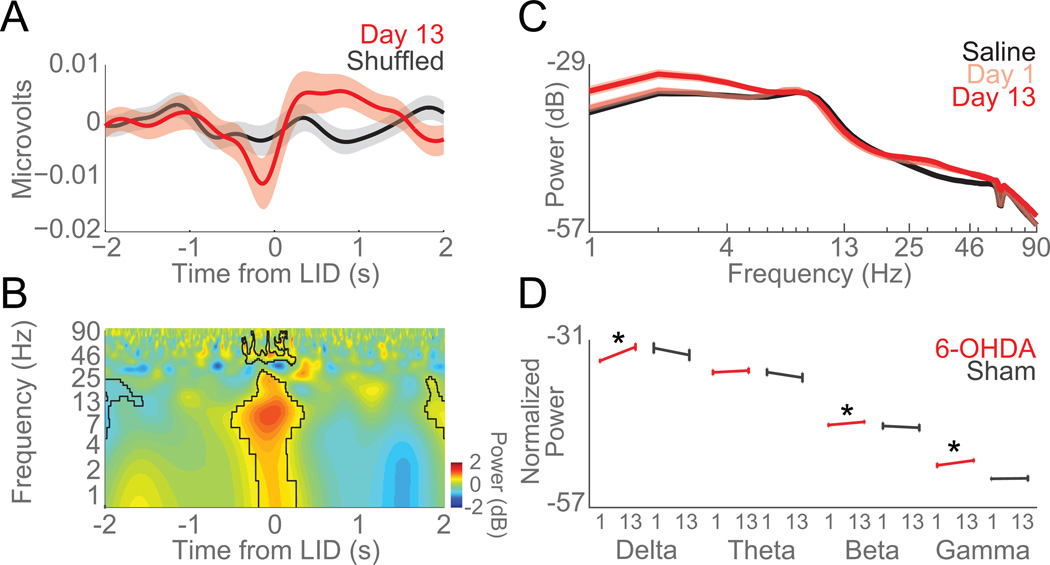
Figure 6. Delta power in striatal local field potentials increases as LIDs develop.
A) Voltage modulation of LFPs around axial dyskinesias (0 s, Time from LID). B) Time-frequency plot of LFPs around axial dyskinesias. Spectral power of LFP activity revealed significant modulations in delta, theta, and beta bands around axial dyskinesias vs. shuffled events (outlined in black). C) Spectral power of striatal LFPs on Saline (black), Day 1 (pink), and Day 13 (red) of levodopa administration. D) Error bar of average normalized power (dB) of 6-OHDA-lesioned mice (red) and sham-lesioned mice (grey) in each frequency band across days (Day 1 and Day 13). Delta, beta, and gamma power significantly increased as LIDs developed in 6-OHDA-lesioned mice (red). No changes were seen in mice with sham lesions (grey). Data from five 6-OHDA-lesioned and four sham-lesioned mice. Error bars are mean ± SEM. (*) p<0.05.

