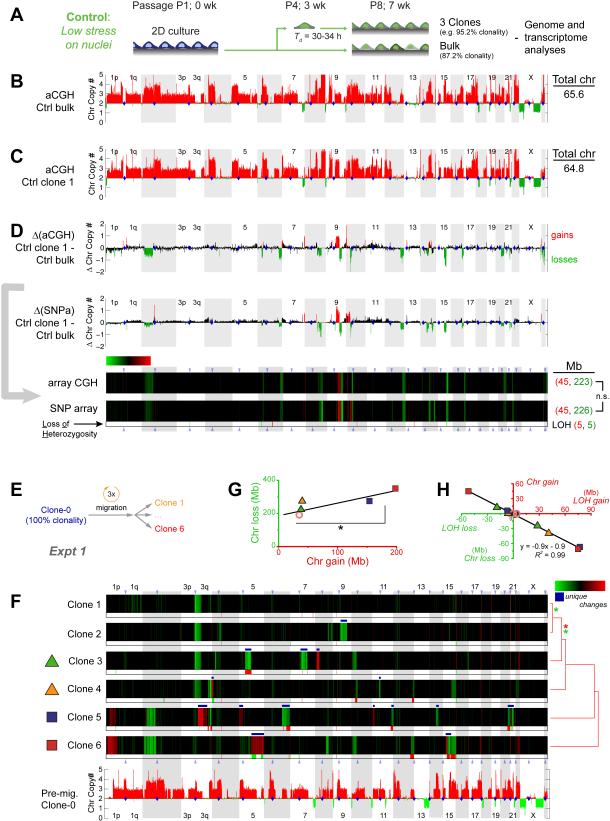
Figure 4. Constricted migration introduces genomic variation.
(A) U2OS culture with 87.2% clonality (Table S1,S6) diluted to single cells in 96-well plates to generate control clones. Genomic analyses included comparative genome hybridization arrays (aCGH) and single nucleotide polymorphism arrays (SNPa).
(B, C) Chromosome copy numbers from aCGH for bulk U2OS (Ctrl_bulk) and one clone (Ctrl_clone-1, Figure S3). Total chromosome numbers are calculated per Table S2.
(D) Differences in chromosome copy numbers between Ctrl_bulk and Ctrl_clone-1 are heat-mapped as changes in chromosome copy numbers (ΔChr copy#). Gain (red) and loss (green) calls in aCGH data were thresholded at ±0.48 based on ΔChr copy# distributions from all pairwise comparisons in Table S1. Ctrl clone 1 shows more net losses and fewer chromosomes. Gain and loss calls for this SNPa comparison were thresholded at +0.6 and -0.2 to match gains and losses of aCG, and KS tests (Figure 3E) show no difference between gain distributions and between loss distributions. SNPa also shows few LOH’s (below heatmap).
(E, F) 100% clonal U2OS after 3 migrations through 3-μm pores was used to make six single cell clones expanded and analyzed by SNPa’s. Compared to pre-migration clone-0, migration causes unique ΔChr copy# (white *) and LOH’s. Clones are listed per hierarchical clustering (city-block metric) of their ΔChr copy#, and asterisks indicate statistical significance (p<0.05 in KS tests) between the distributions of gains (red *) or distributions of losses (green *). Gain and loss calls were thresholded at ±0.42 based on aCGH versus SNPa (see Methods).
(G, H) Chromosome gains and losses reach 100’s of Mb, and two clones (5, 6) show the highest gains (*p<0.05). LOH’s anti-correlate with chromosome copy number changes.

