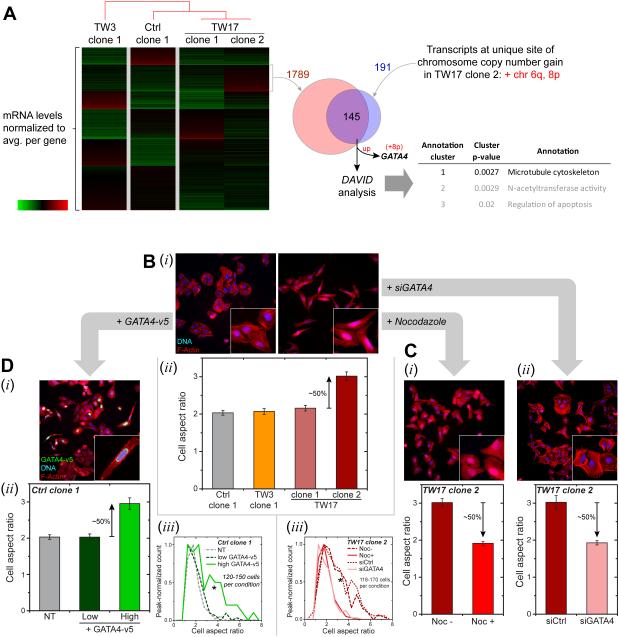
Figure 6. Phenotypic changes driven by migration-induced genome variations.
(A) mRNA from four clones (Ctrl_clone-1, TW3_clone-1, TW17_clone-1 and -2) were normalized by the average value for each gene. K-means clustering applied to the transcriptome data revealed a transcript cluster uniquely up-regulated in TW17_clone-2 (1789 genes). Clones are listed per hierarchical clustering (city-block metric) of transcript levels. Only two chromosome gain regions are unique to TW17_clone-2: Chr 6q and 8p. These unique regions correspond to 191 transcripts in RNA-seq data, with 145 genes upregulated. Functional annotation analysis (DAVID Bioinformatics v.6.7) reveals enrichment of MT cytoskeleton, suggestive of MT upregulation in TW17_clone-2. GATA4 also resides in Chr-8p and is in the overlap list. Similar comparisons with all samples in Figure 5 yield Chr-8p as the only unique chromosome gain region and gives 107 overlapping genes, with MT cytoskeleton statistically enriched and GATA4 listed.
(B) Cell aspect ratio from F-actin staining by phalloidin (i) calculated from major over minor axes (ii). Higher aspect ratios were observed only for TW17_clone-2, indicating more elongated cells (Figure S5, ≥150 cells per condition, n≥ 3expts, *p<0.05).
(C) De-polymerization of MT’s with 10 μM Nocodazole and GATA4 depletion by siGATA4 (Figure S5) on TW17_clone-2 leads to more rounded cells with decreased aspect ratio (i,ii) and shifts in aspect ratio distributions (iii) (≥140 cells per condition, n≥3 expts, KS tests: *p<0.05).
(D) Overexpression of GATA4-v5 in Ctrl_clone-1 elongates cells (i) per higher aspect ratio (ii, Figure S5), shifting the aspect ratio distribution (iii, ≥120 cells per condition, n≥3 expts, KS tests: *p<0.05). Anti-v5 identifies expressing cells.

