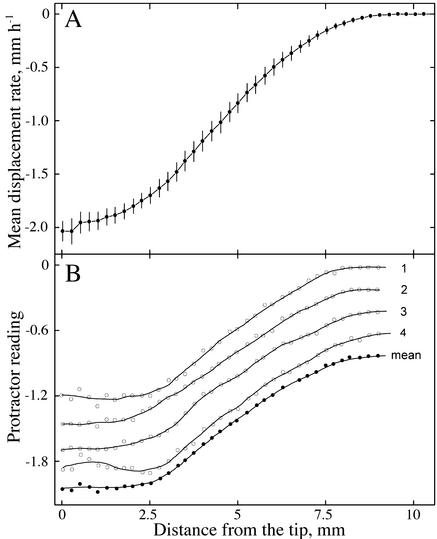
Figure 9.
Figures redrawn from Erickson and Sax (1956) showing the velocity profile for maize roots measured using streak photography. A, (Fig. 4), Average data for 10 roots, ±95% confidence interval. B, (Fig. 3), Raw data measured at four different times from a single root and the mean of the four measurements. Curves are displaced for clarity. The y axis is calibrated in protractor units (actually tangents of the angles made by the streaks), which are proportional to velocity. Solid lines were obtained by numerical smoothing.

