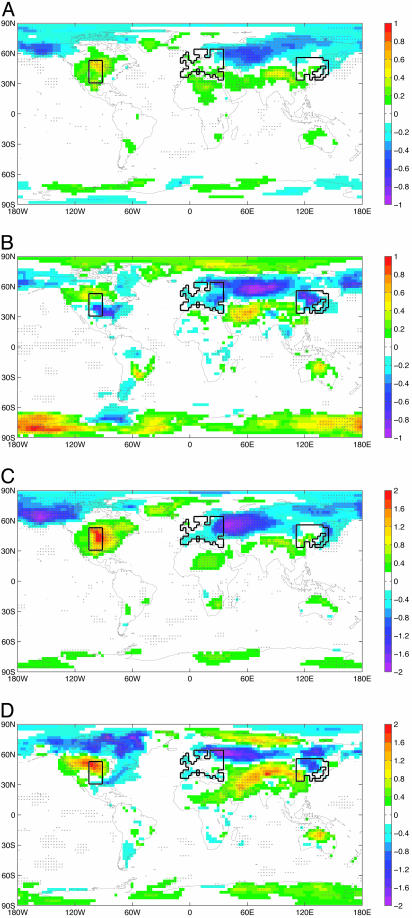
Fig. 1.
Wind-farm array and temperature response. Data are surface (2 m) air temperature, experiment minus control. Drag perturbation, δCD, was 0.005 over the A wind-farm array outlined in black. Points that are significant at P > 0.9 by using a binary t test on annual/seasonal means are indicated (×). NCAR data are 37 yr of perturbed run composed of two runs with differing initial conditions and 108 yr of control composed of five independent runs. GFDL perturbed and control runs are both 20 yr long. NCAR (A) and GFDL (B) annual means are given, as well as NCAR (C) and GFDL (D) winter (December-February) means.

