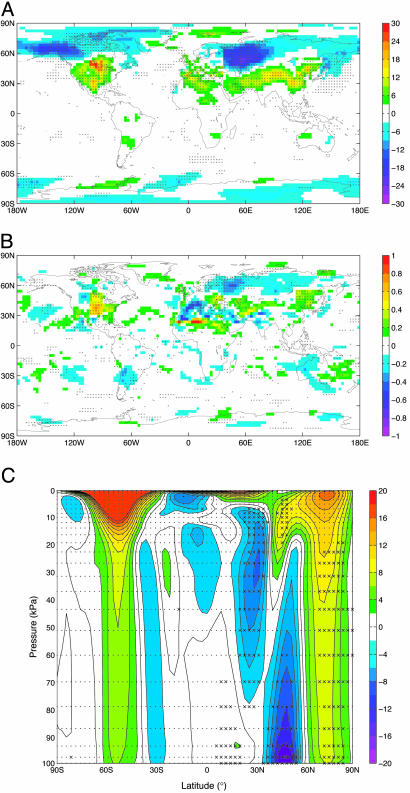
Fig. 3.
Linear coefficient of climatic response in NCAR-linearity ensemble. In all plots, the magnitude at each point is the slope of a least-squares linear fit of the deviation in the given variable with respect to the global δP values using one datum from each of the seven linearity runs shown in Fig. 2. The y intercepts are constrained to zero. Points at which the correlation between the variable and δP was significant at P > 0.9 are indicated (×). (A) Annual mean δT2-m air in mK·TW-1. (B) Ratio change in annual mean precipitation in % TW-1. (C) Annual mean change in zonal wind in mm·sec-1·TW-1. Note that the dipole corresponds to a shift toward the pole of the northern-hemisphere jet.

