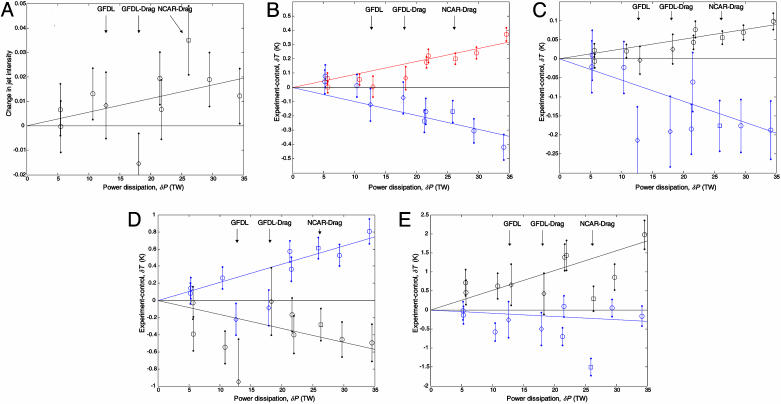
Fig. 4.
Mean climatic response over various masks versus δP. In each plot, the x axis is δP, corresponding to the y axis of Fig. 2. For each point, the seasonal means of a given model run are first integrated over a mask, and differences and standard errors are then computed by using the set of mask integrals for all model years in the experiment and control runs. Results from 10 model runs are shown, all of which use the A array shown in Fig. 1. ○, Data from the seven elements of the NCAR ensemble; □, NCAR drag physics run; and ⋄, data from the two GFDL runs in which the 13 and 18 TW points indicate the roughness length and drag physics runs, respectively. (A) Relative decrease in intensity of the northern-hemisphere jet over a mask that extends from 40-60°N and 100-30 kPa. (B) Annual mean δT2-m air averaged over two separate masks. The red and blue points use a mask defined by the points that are positive and negative, respectively, as well as significant in Fig. 3A. (C) Annual mean δT2-m air over zonal land-surface masks at 25-45°N (black) and 55-65°N (blue). (D) Summer (June-August) δT2-m air for the North American (black) and European (blue) areas of the A wind-farm array shown in Fig. 1. (E) Same as for D, but for winter (December-February).

