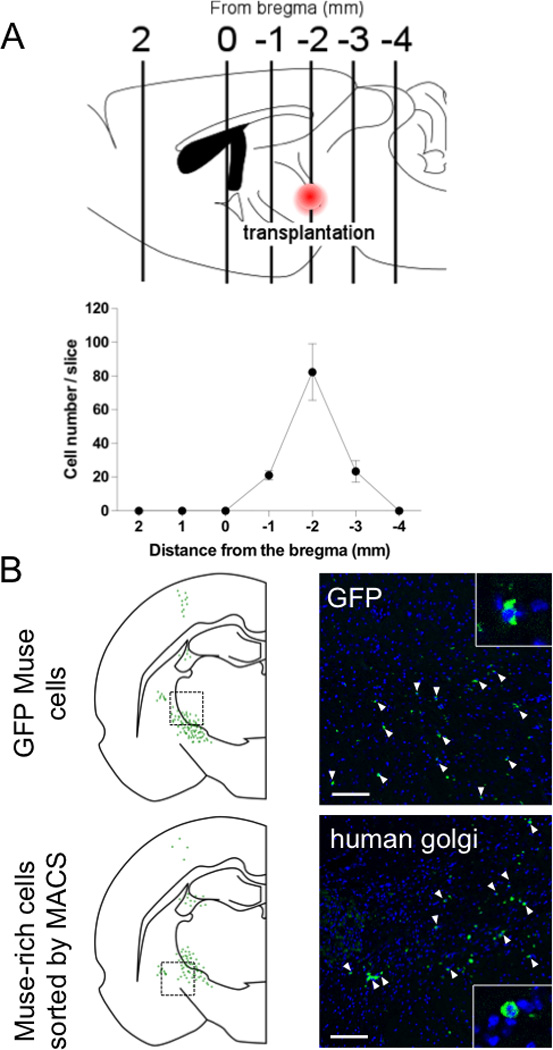
Figure 2. Distribution of transplanted Muse cells in the lacunar infarct brain.

Engrafted Muse cells were counted in each section from the bregma (schema of brain sagittal section) 8 weeks after transplantation (A). At the sections from −2 mm from the bregma, FACS-isolated GFP-Muse cells (white arrow heads) were detected near the lesion site and but were not recognized in contralateral side (B). Similar distribution was observed in the section transplanted MACS sorted serum/xeno free Muse-rich cells (B). MACS sorted Muse-rich cells were stained with anti-human golgi antibody (white arrow heads). Scale bar = 100 µm.
