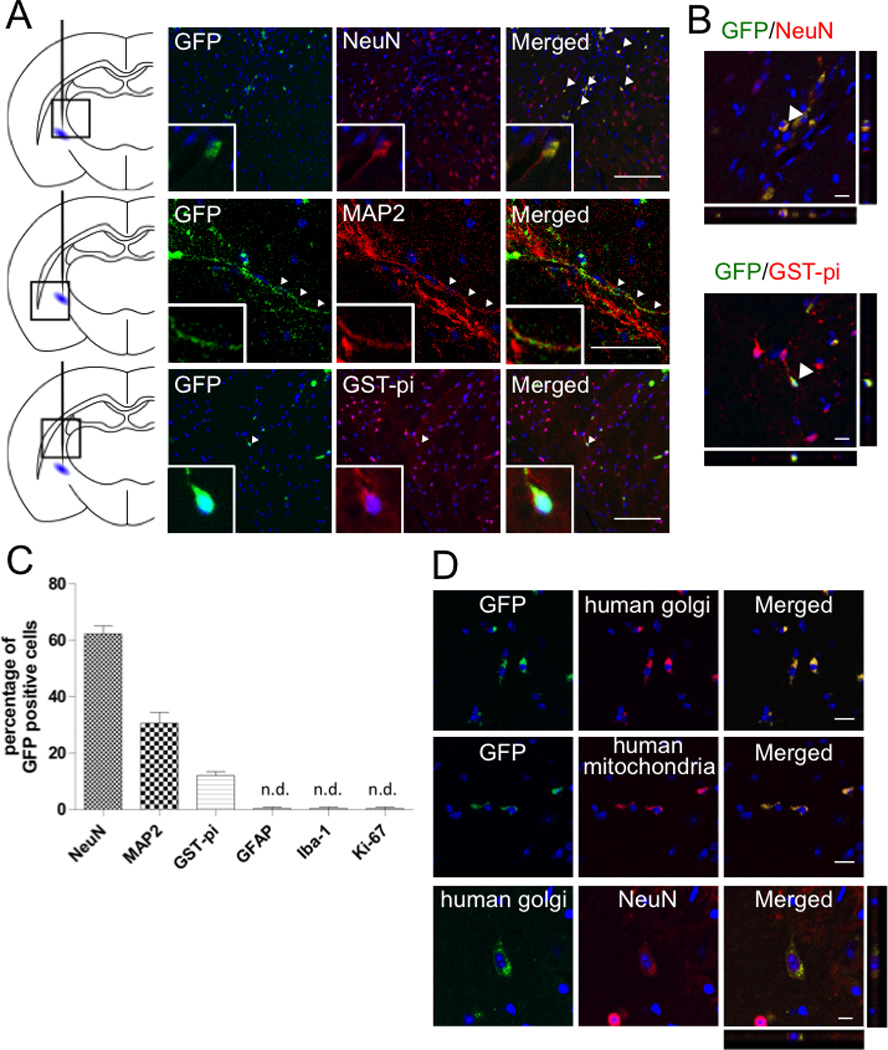
Figure 3. Differentiation of FACS-isolated GFP-Muse cells after engraftment (8 weeks).

GFP-Muse cells, which were positive for NeuN (red), MAP2 (red) and GST-pi (red), were detected near the lesion site (arrow heads) (A, left). Z-axis images strained with NeuN (red) and GST-pi (red) were shown in (A, right). The percentage of each marker among GFP-Muse cells (B). GFP-labeled Muse cells were both positive for human golgi (red) and mitochondria (red) (C). MACS-sorted Muse-rich cells, which were positive for human golgi (green), differentiated into NeuN (red) positive neurons (D). Scale bars, A (left) = 100 µm; A (right), C and D = 10 µm.
