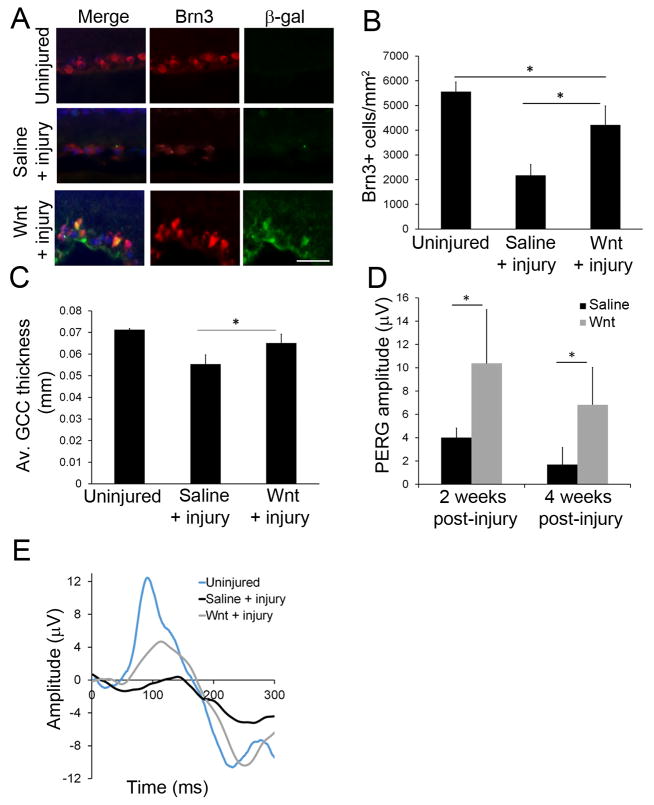
Fig 2. Wnt3a increased RGC survival after axonal injury.
(A) Immunohistochemistry of the GCL region of injected retinas, showing codetection of the RGC marker protein Brn3 and the Wnt reporter β-gal, indicating activated Wnt signaling within RGCs. Additionally, more Brn3-positive cells were observed in the Wnt3a + injury group than the saline + injury group, indicating increased survival of RGCs after Wnt stimulation. Scale bar = 50μm. (B) Quantification of pan-Brn3 immunopositive cells that colocalized with DAPI, showing increased cells (putative RGCs) in Wnt3a-injected mice. n=4 mice per group. *p<0.05. (ANOVA, F = 36.97, df = 11; Tukey’s post-hoc test, Uninjured vs Saline + injury: p = 0.001, Uninjured vs Wnt + injury: p = 0.01952, Saline + injury vs Wnt + injury: p=0.0016.) (C) Quantification of the ganglion cell region (including the NFL, GCL and IPL layers) by OCT imaging indicated a thicker ganglion cell region in the Wnt3a injected mice compared with the saline injected animals. n=3 mice per group. *p<0.05. (ANOVA, F = 14.3, df = 8; Tukey’s post-hoc test, Uninjured vs Saline + injury: p = 0.0033, Uninjured vs Wnt + injury: p = 0.1518, Saline + injury vs Wnt + injury: p = 0.0322.) (D) Quantification of RGC function using PERG recordings at 2 and 4 weeks post-crush, showing higher amplitude in retinas injected with Wnt3a after axonal injury compared with saline. n=4 mice per group, *p<0.05 (t-test, 2 weeks: t = 3.704, df = 6, p = 0.01; 4 weeks: t = 3.576, df = 6, p = 0.0117). (E) Representative RGC-generated PERG waveforms at 2 weeks post-crush responses.

