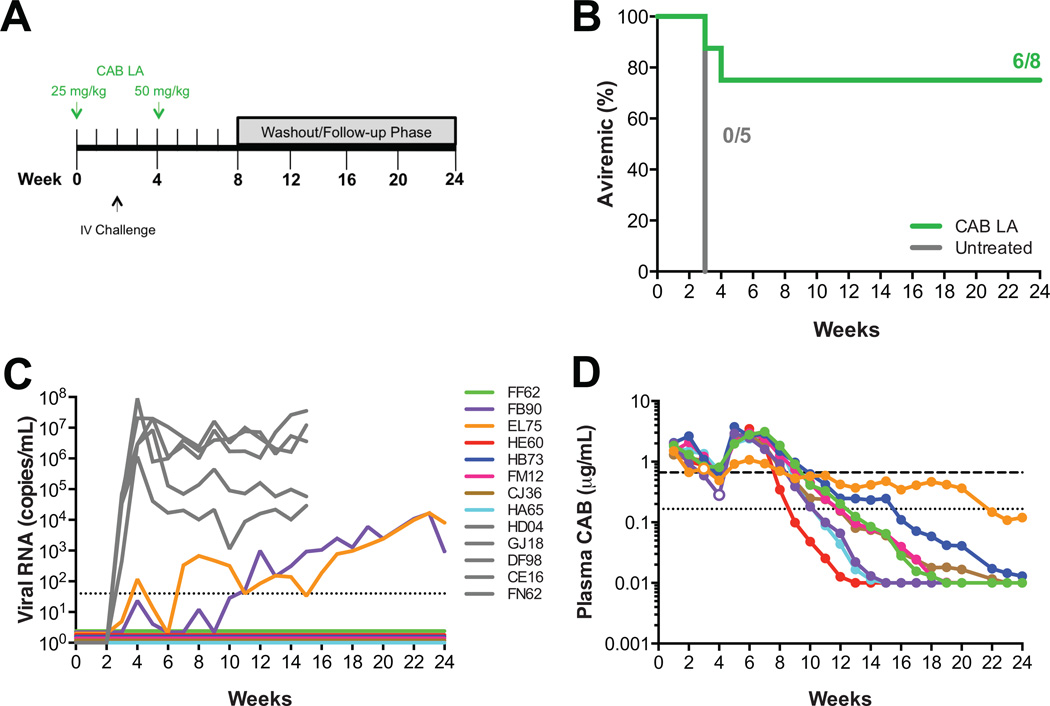
Fig. 3.
Lower plasma CAB concentrations at time of intravenous SIV challenge result in infection. (A) Study design. Eight macaques were dosed with 25 mg/kg CAB LA on week 0 and 50 mg/kg CAB LA on week 4. Macaques were challenged intravenously on week 2 with SIVmac251. (B) Kaplan-Meier plot of CAB LA-treated (green) and untreated (gray) rhesus macaques remaining aviremic following intravenous challenge. (C) Plasma viremia in control rhesus macaques (in gray) and CAB LA-treated rhesus macaques (in color). Dotted line represents the LOQ, >40 SIV RNA copies/mL plasma. Baseline values are offset from each other for clarity. (D) Pharmacokinetic profile of plasma CAB concentrations in individual macaques. Open symbols correspond with plasma concentration at the time of first vRNA detection for infected macaques. Dotted and dashed horizontal lines represent 1× and 4× PAIC90, respectively.

