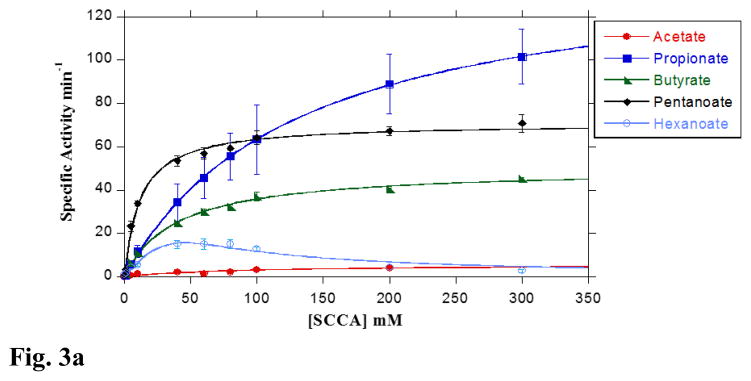
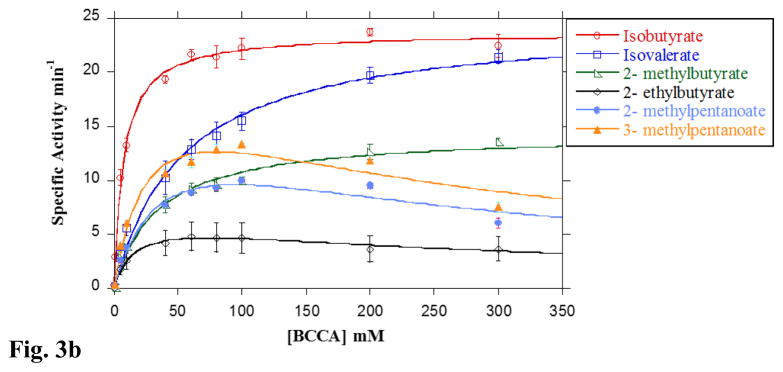
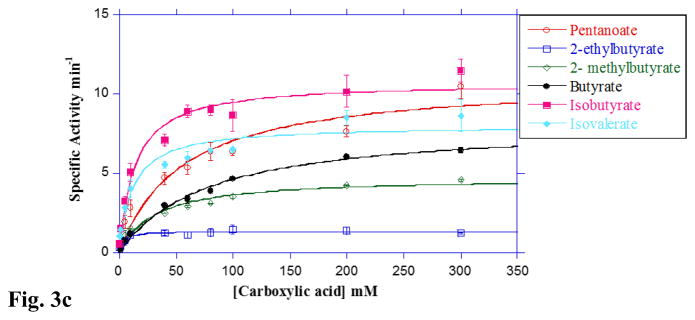
Fig 3. Substrate preference of LmBuk.
A. Concentration-dependent activity of LmBuk in the presence of SCCA substrates at 37 °C. The observed initial rates of reaction for the substrates acetate (closed circles), propionate (closed squares), butyrate (closed triangles), pentanoate (closed diamonds) and hexanoate (open circles) catalyzed by LmBuk were determined at 37 °C in the presence of 10 mM ATP under standard assay conditions (see Materials and Methods). Data were plotted as a function of the substrate concentration and KM and kcat were determined from the fit of the data to the Michaelis-Menten equation using Kaleidagraph software. Data derived for hexanoate was fitted to the Michaelis-Menten equation to include substrate inhibition. Data are means ± SEM of at least three experiments. B. Concentration-dependent activity of LmBuk in the presence of BCCA substrates at 37 °C. The observed initial rates of reaction for the isobutyrate (open circles), isovalerate (open squares), 2-methyl butyrate (open triangles) and 2-ethyl butyrate (open diamonds), 2-methyl pentanoate (closed circles) and 3-methyl pentanoate (closed triangles) catalyzed by LmBuk were determined at 37 °C in the presence of 10 mM ATP under standard assay conditions (see Materials and Methods). Data were plotted as a function of the substrate concentration and KM and kcat were determined from the fit of the data to the Michaelis-Menten equation using Kaleidagraph software. Data derived for 2-ethylbutyrate, 2-methylpentanoate and 3-methylpentanoate was fitted to the Michaelis-Menten equation to include substrate inhibition. Data are means ± SEM of at least three experiments. C. Concentration-dependent activity of LmBuk at 10 °C in the presence of SCCA and BCCA substrates. The observed initial rates of reaction for the isobutyrate (closed squares), isovalerate (closed diamonds), 2-methyl butyrate (open diamonds) and 2-ethyl butyrate (open squares), pentanoate (open circles) and butyrate (closed circles) catalyzed by LmBuk were determined at 10 °C in the presence of 10 mM ATP as described under “Materials and Methods”. Data were plotted as a function of the substrate concentration and KM and kcat were determined from the fit of the data to the Michaelis-Menten equation using Kaleidagraph software. Data plotted are means ± SEM of at least three experiments.


