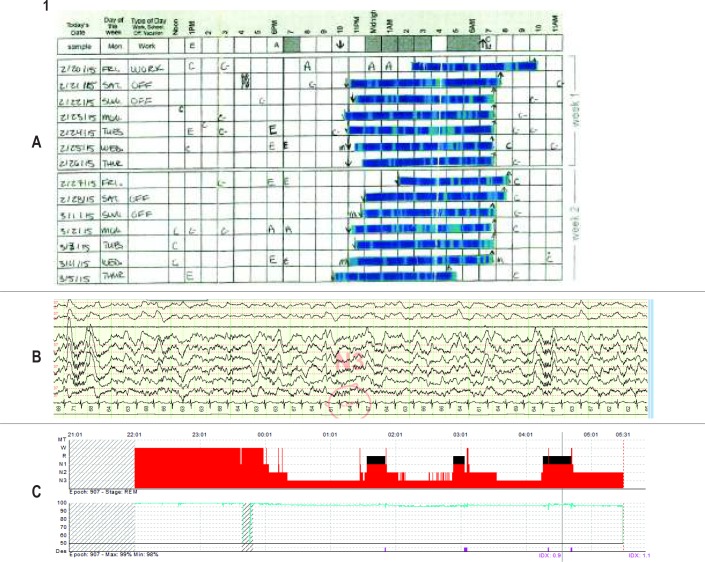
Figure 1.
(A) Ms. B's 2-week sleep diary, created by the patient cutting and pasting (by hand) sleep tracker data. (B) Segment of Ms. B's polysomnogram demonstrating alpha frequency in N2 and N3 sleep. (C) Ms. B's hypnogram and oxygen saturation, demonstrating increased proportion of N3 sleep, average number of awakenings, and few oxygen desaturations.

