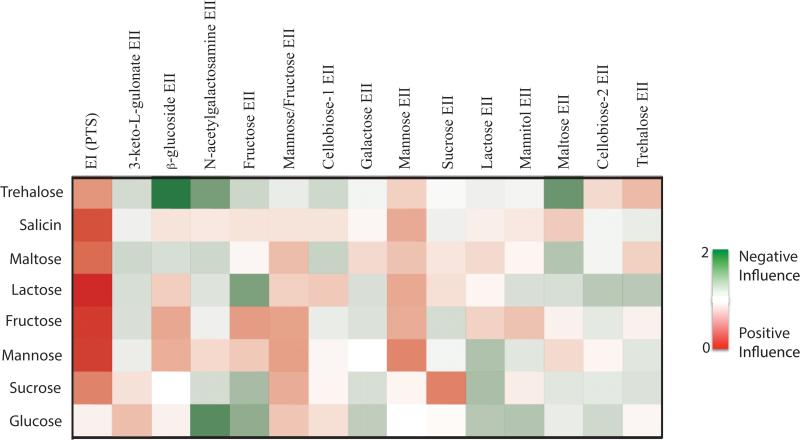
Figure 4. Influence of each EII on the metabolism of PTS carbohydrates.
Heat map of the relative influence of each EII on growth in a particular PTS sugar (Influence Score) was calculated as described in Experimental Procedures. Green indicates a negative influence of an EII for the metabolism of a PTS sugar, red indicates a positive influence of an EII for the metabolism of a PTS sugar, and white indicates no influence. Relative influence is reflected by intensity of color.

