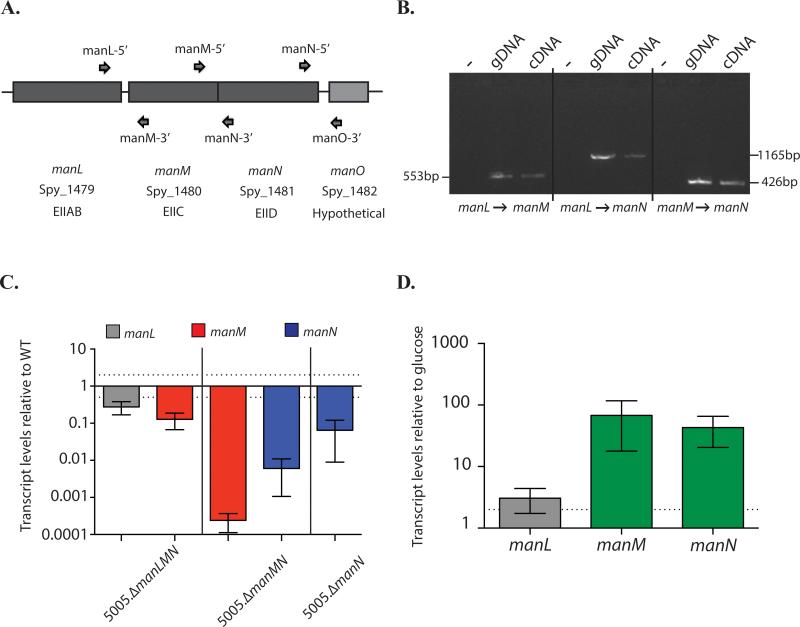
Figure 6. Transcriptional architecture of the mannose PTS EII operon.
(A) Graphical representation of the mannose-specific EII genetic locus. Primers for RT-PCR are also shown (arrows) (B) RT-PCR was performed on RNA isolated from MGAS5005 grown to late-logarithmic phase in THY using primers in gene pairs as indicated below. Bands indicate genes are transcribed together. (C) Polarity of each mannose EII subunit was assessed using qPCR. Primers are located in the middle of each gene. (D) Induction of the mannose operon when GAS is grown in mannose was determined. RNA was isolated in MGAS5005 grown in glucose and mannose, and relative transcript levels were compared using qPCR. Each bar is the average of 3 independent biological replicates, depicted with the standard error. Dotted lines represent 2 fold difference in expression.

