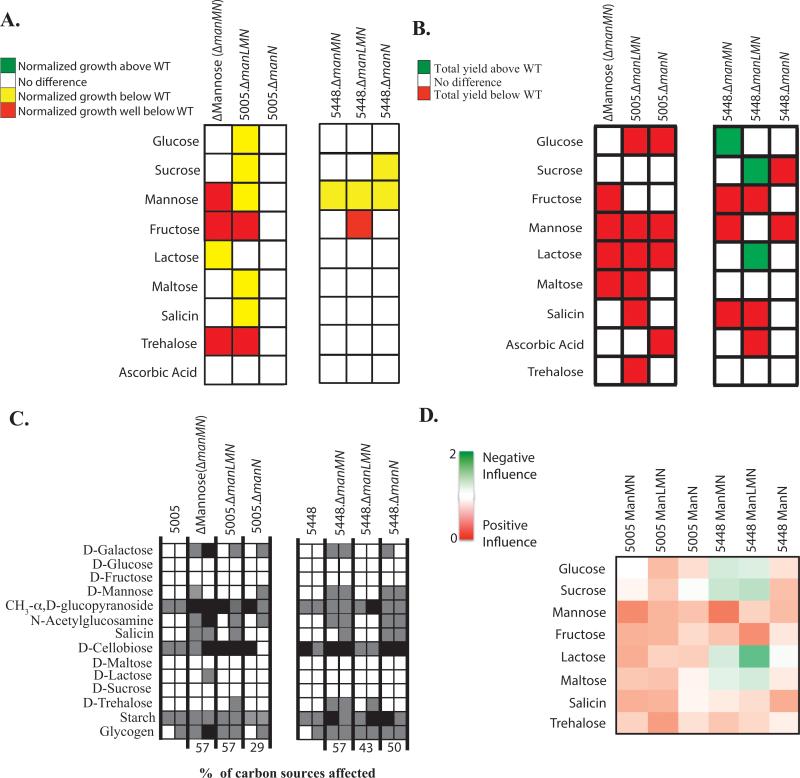
Figure 7. Metabolic profile of the mannose EII subunit mutants.
(A) Growth curve analyses were performed as fully described in Experimental Procedures for manLMN mutants in 5448 (right) or MGAS5005 (left). Growth in a particular PTS sugar of the mutant above WT (green), below WT (yellow), significantly below WT (red), or similar to WT (white) are indicated. (B) Change in growth (ΔOD) of manLMN mutants was calculated as described in Experimental Procedures. ΔOD of mutants in a particular PTS sugar that were significantly above WT (green, p-value <0.05) or below WT (red, p-value <0.05) are indicated. Only PTS sugars facilitating growth of MGAS5005 are shown. All results represent at least three independent biological replicates. (C) Utilization of select carbon sources by manLMN mutants as determined using the API®50CH system and described in Experimental Procedures. Only carbon sources that are utilized by at least one of the strains tested are shown. White boxes indicate utilization (+), grey boxes indicate partial utilization (+/−), and black boxes indicate no utilization (−). Readings for each strain are given for 24h (left box) and 48h (right box). (D) Heat map of the relative influence of manLMN mutants on growth in a particular PTS sugar (Influence Score) was calculated as described in Experimental Procedures. Green indicates a negative influence of an EII for the metabolism of a PTS sugar, red indicates a positive influence of an EII for the metabolism of a PTS sugar, and white indicates no influence. Relative influence is reflected by intensity of color.

