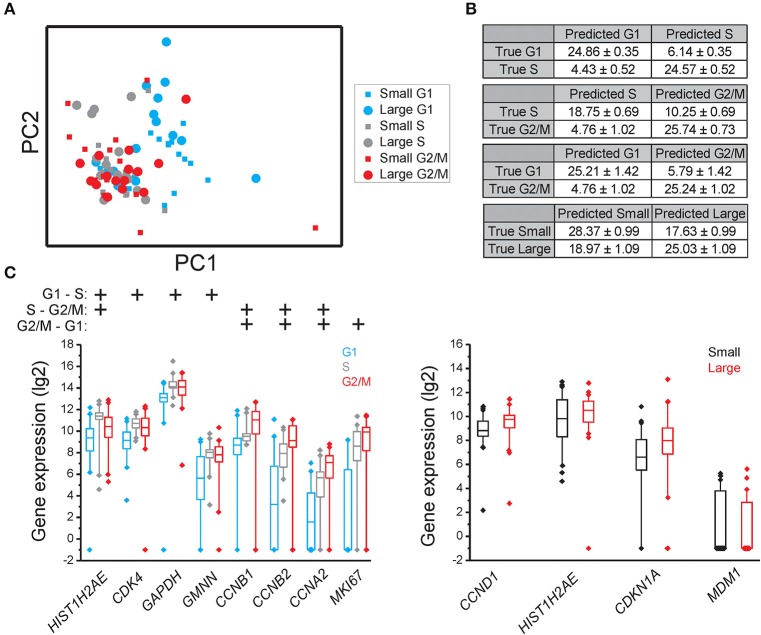
Figure 3.
Cell cycle phase and cell size dependent gene expression in MCF7. (A) PCA of small and large MCF7 cells in the G1, S, and G2/M phases. Each dot and square represents a single cell. (B) Confusion matrices of cell classifications using the random forests algorithm. Fisher's exact test was used to calculate significance (p < 0.0001) for all matrices. The confusion matrix of small compared to large cells was not significant. (C) Box-Whisker plots for the genes with highest importance to classify cell cycle phase and cell size using the random forests algorithm. The box ranges between the 25 and 75%, the whiskers range between the 5 and 95% of all data and outliers are indicated as diamonds.

