
FIGURE 2.
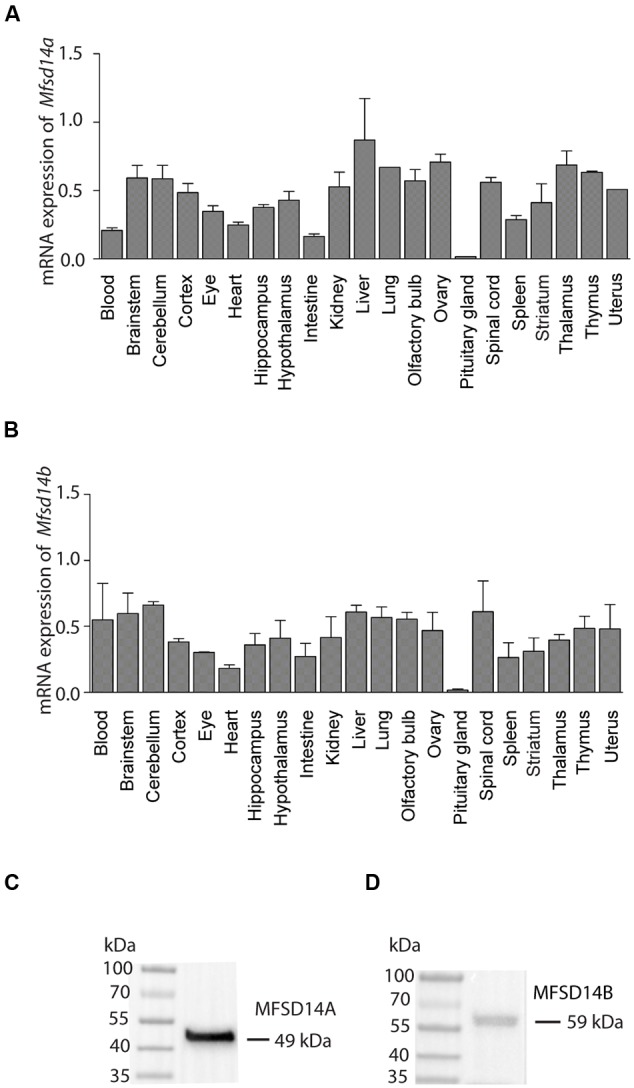
mRNA expression of Mfsd14a and Mfsd14b in mouse tissue. qRT-PCR analysis of mRNA expression in brain and peripheral tissue samples from adult C57Bl6/J mice. The mRNA expression was normalized using four stable housekeeping genes (bTub, Rpl19, Cyclo, and Actb), the tissue with the highest gene expression for each transporter was set to 100% and the relative expression levels of the tissue plotted (±SD). (A) Relative expression of Mfsd14a with the highest levels in liver set to 100%. (B) Relative expression of Mfsd14b with the highest levels in liver set to 100%. Verification of antibodies used in the histological methods was performed using Western Blot with a protein preparation made from mouse brain. (C) Staining for MFSD14A gives a band at 49 kDa (expected size at 53 kDa) and (D) staining for MFSD14B gives a band at 59 kDa (expected size at 55 kDa).