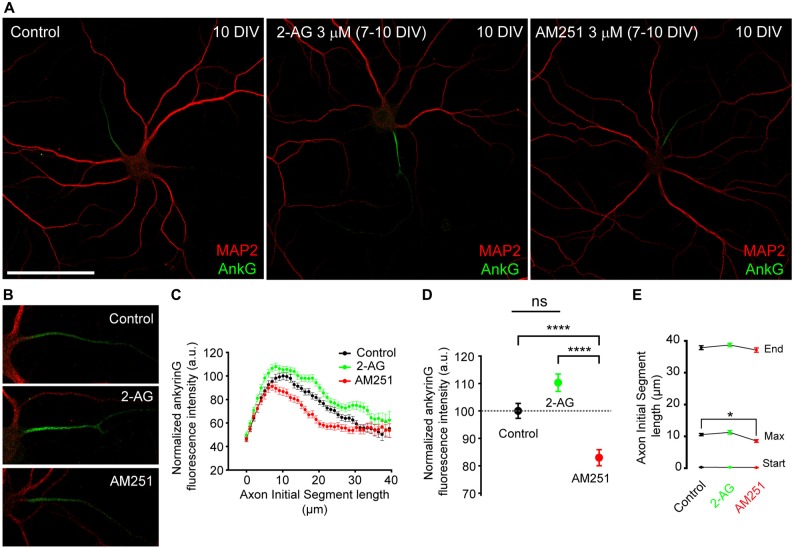
Figure 4.
CB1R inhibition, after dendrites formation, diminishes ankyrinG expression at the AIS. (A,B) 10-DIV hippocampal neurons treated daily with cannabinoid receptor agonist 2-AG or CB1R antagonist AM251 from 7 to 10 days. High-magnification pictures of the AIS of each neuron are shown in (B). Scale bar = 100 μm. (C) AnkyrinG fluorescence intensity profile along the AIS in control, 2-AG- or AM251-treated neurons. Data were acquired from three independent experiments (30 neurons/experimental condition in each experiment). (D) Normalized ankyrinG total fluorescence intensity at the AIS of neurons represented in (C). (E) Graph representing the mean ± SEM of the start and end positions of the AIS, as well as, the position of the maximum fluorescence intensity at the AIS for each experimental condition. Kruskal-Wallis, Dunn’s multiple comparisons test. Adjusted p values: *p < 0.05; ****p < 0.0001, ns, non-significant; a.u., arbitrary units.

