Figure 6.
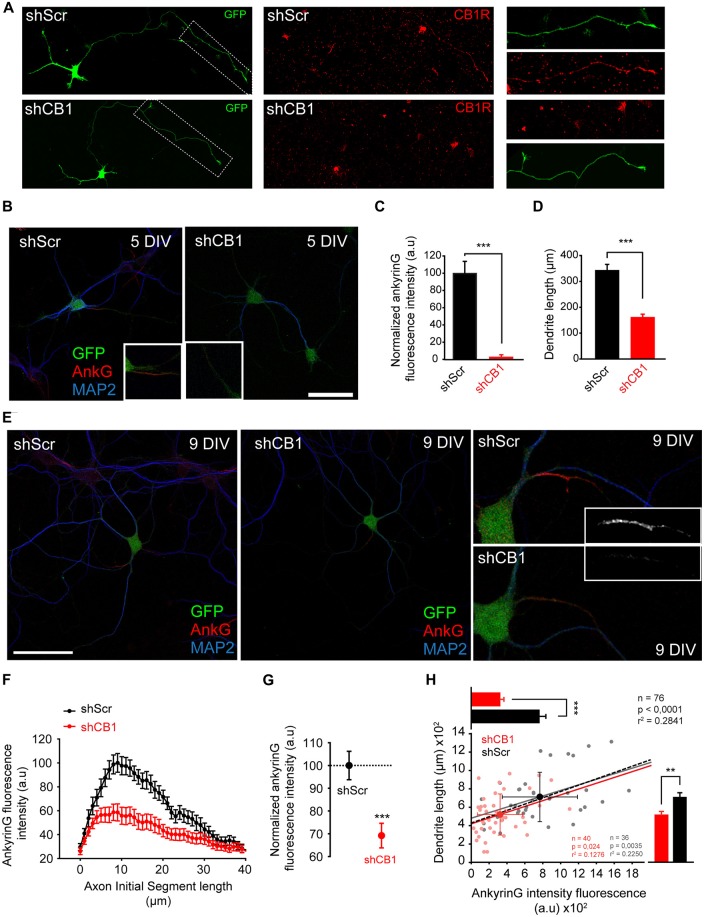
Early CB1R suppression decreases ankyrinG concentration at the AIS and reduces dendritic length. (A) 3-DIV hippocampal neurons nucleofected with scrambled interference RNA (shScr) or CB1R interference RNA (shCB1). Nucleofected neurons were identified based on GFP fluorescence. Surface CB1 receptor expression (red) was identified using a CB1R antibody that recognizes an extracellular epitope at the N-terminal domain. Note that CB1R staining was performed in living neurons at 37°C and neurons were rinsed quickly before fixation, generating the observed background. (B) Representative images of 5-DIV hippocampal neurons nucleofected with CB1R interference RNA (shCB1) or scrambled interference RNA (shScr). Neurons were stained with MAP2 antibody (blue) and ankyrinG antibody (red). Nucleofected neurons were identified based on GFP fluorescence. Insets show the AIS region. Note the strong reduction of ankyrinG staining and dendritic length in 5 DIV shCB1 neurons compared to shScr neurons. (C,D) Bar plots representing the mean ± SEM of normalized total AnkyrinG fluorescence intensity along the AIS (C) and total dendritic length of 5-DIV nucleofected neurons (D, n = 24, 13 shScr, 11 shCB1). (E) Representative images of 9-DIV hippocampal neurons nucleofected with CB1R interference RNA (shCB1) or scrambled interference RNA (shScr). Scale bar = 100 μm. The right panels show higher-magnification images of the AIS for the nucleofected neurons represented on the left panels. (F) AnkyrinG fluorescence intensity profile along the AIS of shScr- or shCB1-nucleofected neurons. Data were obtained from at least 40 neurons of each condition from three independent experiments. (G) Normalized ankyrinG total fluorescence intensity at the AIS for the neurons represented in (B). Mann-Whitney Rank test *** p < 0.001. (H) Cell-to-cell analysis of the relationship between dendrite length and ankyrinG total fluorescence intensity at the AIS in 9-DIV nucleofected neurons. Scatter plot illustrating the significant correlation between ankyrinG intensity fluorescence (x-axis) and dendrite length (y-axis) of 76 nucleofected neurons (36 shScr, gray dots; 40 shCB1, light red dots). Regression lines and the r2 and p values for all neurons (black), for shScr neurons (gray) and shCB1 neurons (red) are indicated on the graph (Pearson product moment test). Bright colored dots represent the average (± SD) for the two groups. The bar plots shown on the right and top of the graph represent the mean (± SEM) for the cells plotted for each group, and significant statistical differences are represented. Mann-Whitney Rank test. ***p < 0.001, **p < 0.01. a.u., arbitrary units.

