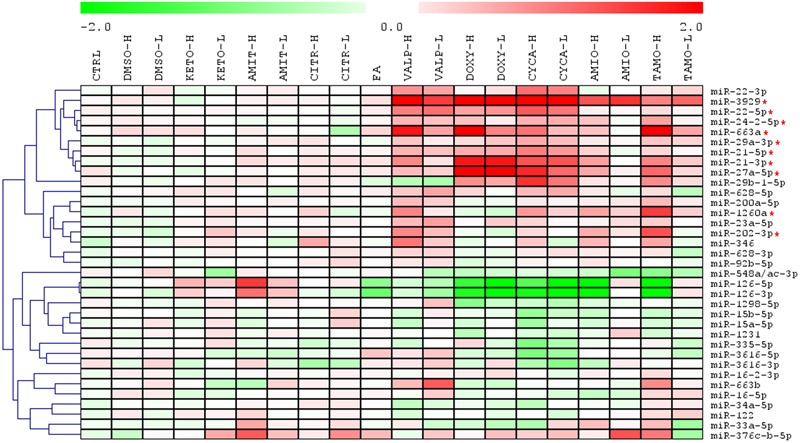
FIGURE 2.

Heatmap clustering analysis of expression patterns of 35 miRNAs reveals that steatotic drugs have a common fingerprint. HepG2 cells were treated with model steatotic (VALP, DOXY, CYCA, AMIO, and TAMO) and non-steatotic (DMSO, KETO, AMIT, and CITR) compounds for 24 h. Two different non-cytotoxic concentrations (labeled H and L) were used. FA 0.6 mM (2:1 oleate:palmitate). Intracellular miRNA levels were analyzed by qRT-PCR-TaqMan assays in 3–5 independent experiments and normalized with the mean of miR-let7a and miR-25. Heatmap and clustering was carried out with MeV: MultiExperiment Viewer. Red asterisk denotes miRNAs upregulated by most steatotic drugs.
