
FIGURE 5.
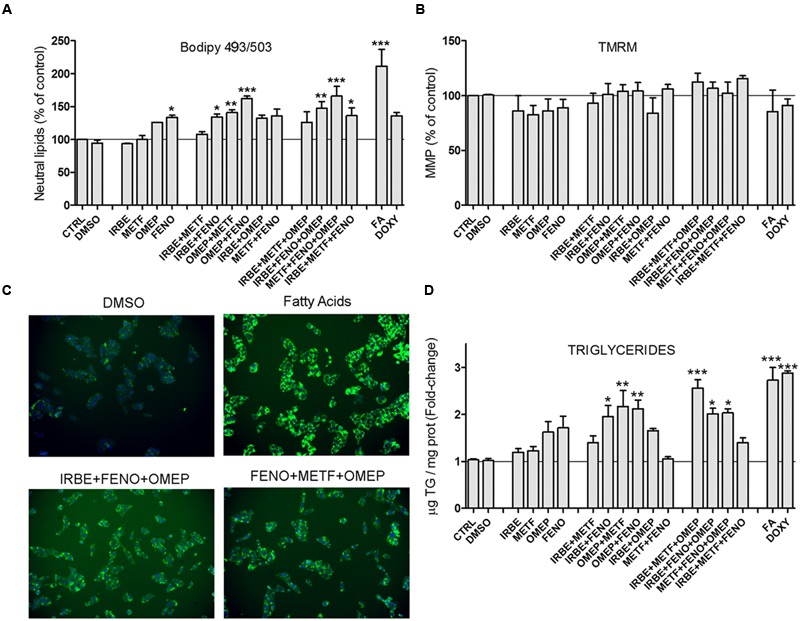
Some common drugs for NAFLD patients induce fat accumulation in cultured human hepatic cells. HepG2 cells were treated with IRBE, METF, OMEP, and FENO as explained in the legend to Figure 4. Neutral lipid content (BODIPY 493/503) (A) and MMP (TMRM) (C) were quantified by HCS. (B) Representative images from the HSC showing the fluorescence of BODIPY493/503 (neutral lipids; green) and Hoechst 33342 (nuclei; blue). Intracellular TG levels were also determined in parallel cultures (D). Bars represent the mean ± SEM (n = 3–4). ∗p < 0.05, ∗∗p < 0.01, ∗∗∗p < 0.001, ANOVA, Tukey post hoc.