
FIGURE 2.
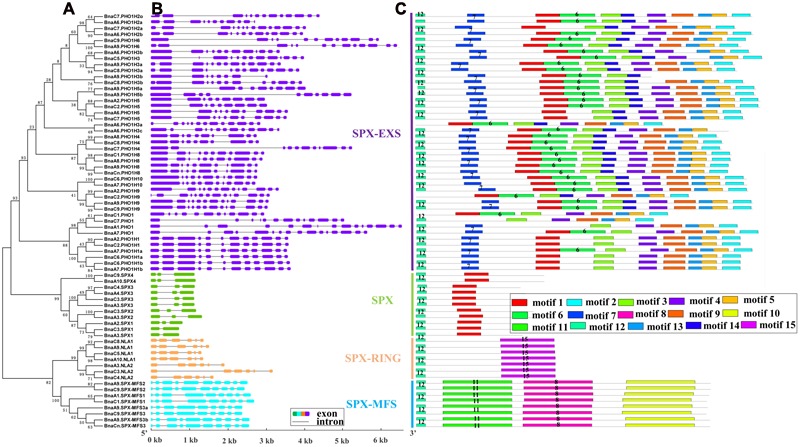
Schematic representations of the exon–intron compositions and conserved motifs of the BnaSPX genes. (A) NJ phylogenetic tree of BnaSPXs. (B) Exon-intron organization of BnaSPX genes. Double-sided wedge boxes represent exons and gray lines represent introns. Different colors indicate different SPX gene subfamilies. The exon and intron sizes can be estimated using the scale at the bottom. (C) Distribution of conserved motifs in BnaSPX proteins. Different motifs are shown by different colors numbered 1–15. Some motifs are highlighted with different colored boxes with numbers. Lines represent protein regions without a detected motif.