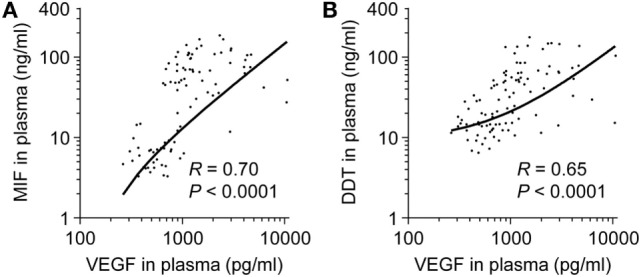
Figure 5.

Comparison of macrophage migration inhibitory factor (MIF) and d-dopachrome tautomerase (DDT) to vascular endothelial growth factor (VEGF) plasma concentrations. Scatterplot comparing MIF (A) and DDT (B) to VEGF plasma concentrations in paired measurements from 14 fetuses, 14 preterm and 18 term newborns (umbilical vein), and from peripheral blood of 11 term newborns (on postnatal day 4), 17 infants, 14 children, and 15 adults. The regression lines are shown.
