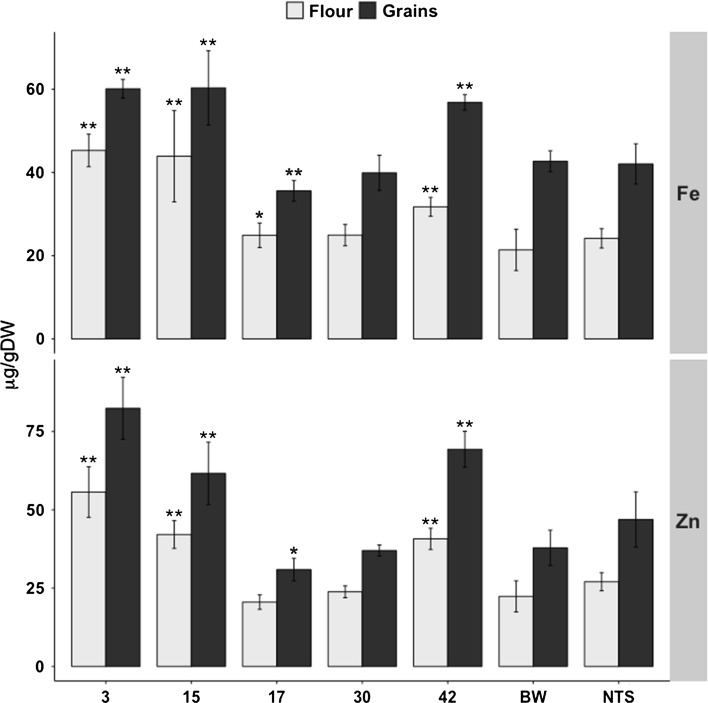
Fig. 5.
Iron (Fe) and zinc (Zn) content in T4 grains and flour of lines expressing PvFERRITIN-OsNAS2 (FerNas-BW). Values are the mean of three biological replicates (±SD). Black and red asterisks above the bars indicate statistically higher and lower significant values calculated using Student’s T test, respectively, in comparison to the control line Bobwhite (BW) (*P < 0.05; **P < 0.01). NTS non-transgenic sibling

