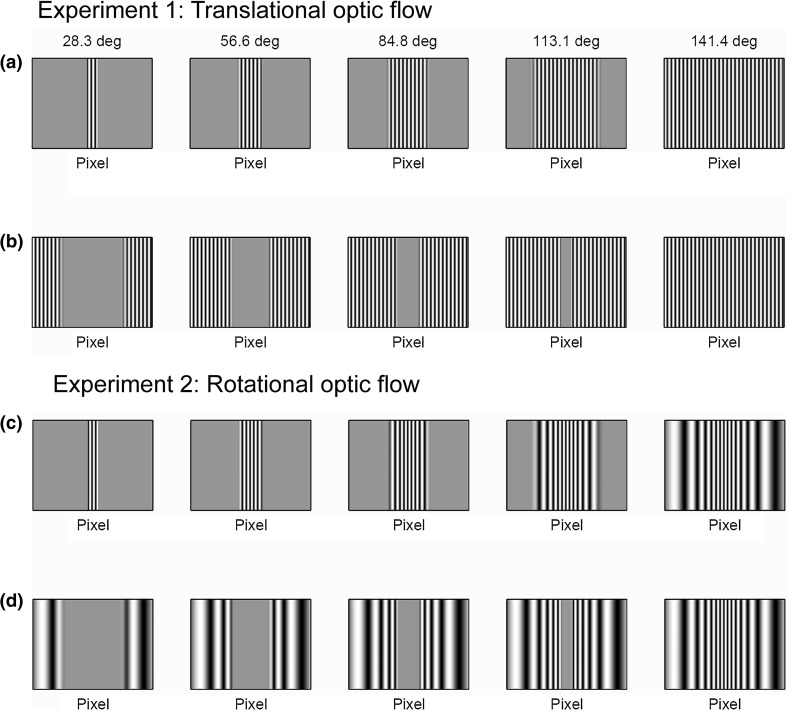
Fig. 2.
Screen previews of the central (a, c) and peripheral (b, d) stimuli. a, b Stimuli used in Experiment 1. c, d Stimuli used in Experiment 2. The number above each plot is the sum of visual degrees subtended by the gratings in each condition. Gratings in each vertical pair within an experiment subtend the same visual angle in total. Note that the same visual angle takes up more of the screen area near the edge of the screen than near the centre (see geometry in Fig. 4)

