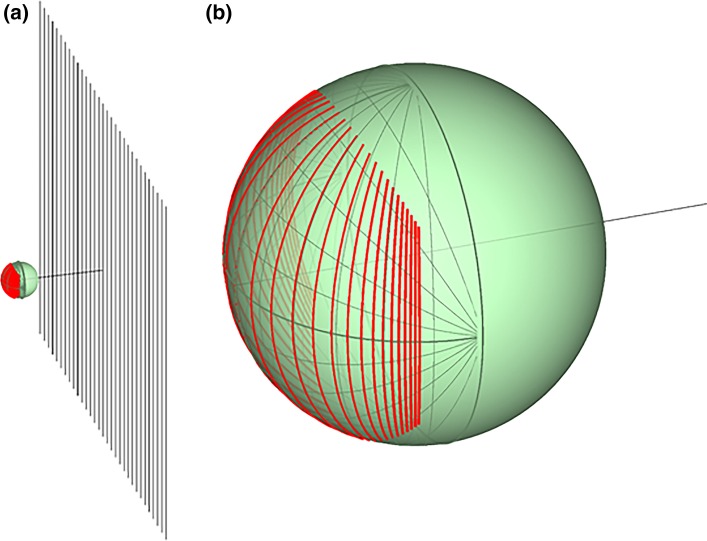
Fig. 3.
The stimulus on the mantis retina. a The straight black lines represent the peaks of a sinusoidal luminance grating on the planar monitor. The green sphere represents the visual field of an observer at the position of the mantis, 7 cm from the middle of the screen. The red lines show where each black line projects to on the visual field. b Zoomed-in version of the visual field. The thin green lines mark on an azimuth-longitude/elevation-longitude coordination system, lines drawn at 15° intervals, while the thick red lines show where the stripes of the sine grating project to. Each stripe is a line of longitude on the visual sphere, but the angle between successive stripes gets smaller as eccentricity increases. This means that the spatial frequency of the pattern increases with eccentricity. The angular speed of the motion, therefore, decreases (speed = temporal frequency/spatial frequency)

