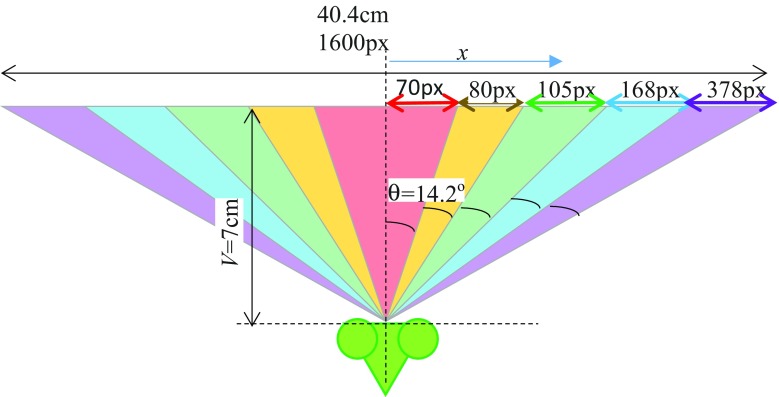
Fig. 4.
Top-down view of the mantis in front of the computer screen. The colours show the 5 different regions within which grating stimuli were presented (Fig. 1). We use x to represent horizontal position on the screen, in pixels, and θ to represent angular position in the visual field; tanθ = x/V, where V is the viewing distance. All marked angles are the same, i.e. 14.2°. Thus, when we consider its locations on either side of the midline, each region covers a total of 28.3°

