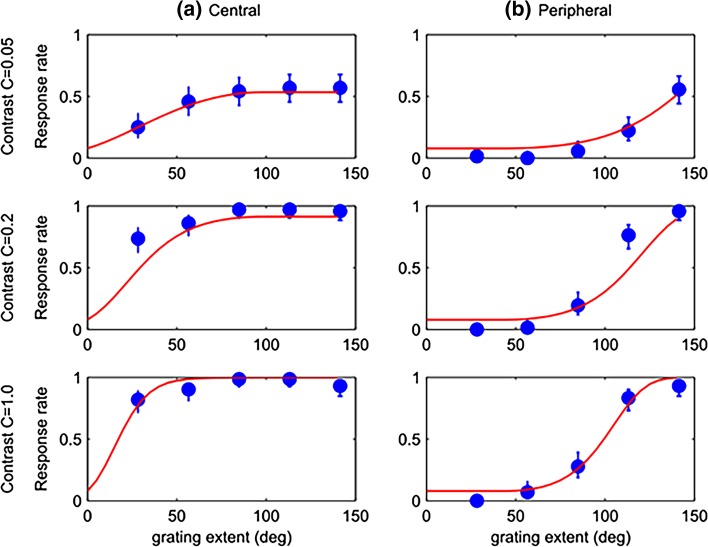
Fig. 5.
Mantis psychometric functions for Experiment 1. Blue symbols show the mean response rate (probability of observing the optomotor response) as a function of the angle subtended by the moving grating. Error bars represent the 68% confidence interval assuming simple binomial statistics (equivalent to ±1 standard error for normally distributed data). Columns represent responses to central (left) and peripheral (right) stimuli. Rows represent responses to different contrasts. The red curves show the results of a model with 2 free parameters which were fitted simultaneously to all 6 conditions (30 data points) (M = 0.064, b = 49°; see “Methods” section for details)

