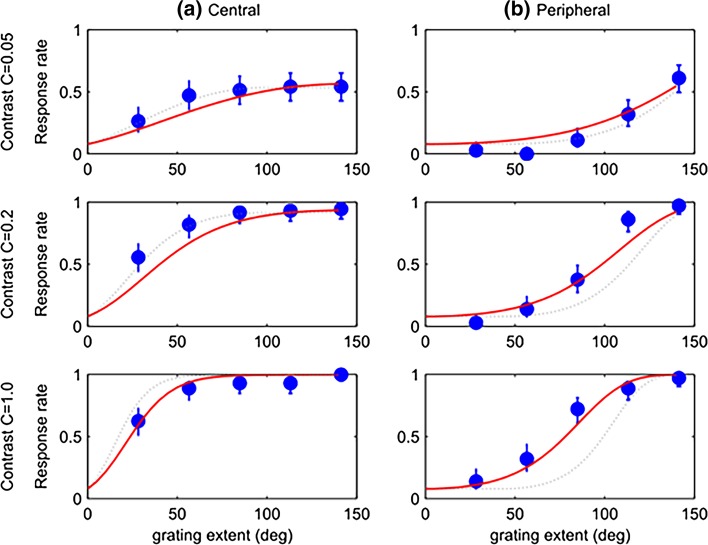
Fig. 6.
Mantis psychometric functions for Experiment 2; other details as for Fig. 3. The red solid curves show the results of a model with 2 free parameters fitted simultaneously to these data (M = 0.046, b = 71°); for comparison, the dotted curves show the Experiment 1 fits (M = 0.064, b = 49°, as shown previously in Fig. 5)

