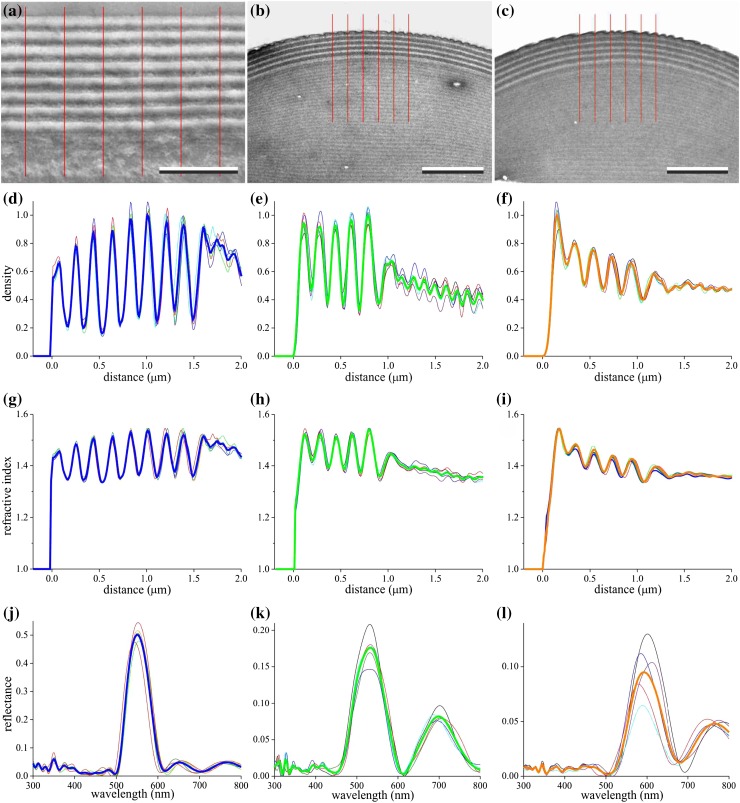
Fig. 2.
Transmission electron microscopy and modeled reflectance spectra of head cuticle and facet lenses. a–c Local sections of the head cuticle (a) and the two types of facet lenses (b, green; c, orange). The red lines mark lanes with 0.5 µm width; bars a 1 μm, b and c 2 μm. d–f Density profile of the part of the 5 lanes of (a–c) normalized to the maximum of the mean profile (bold curves). g–i Refractive indices (at 550 nm) derived from the density profiles of (d–f) by assuming that the refractive index is proportional to the density and is restricted to the range between the refractive indices of chitin and water. j–l Reflectance spectra for normal illumination calculated with the refractive index profiles of (g–i); bold curves averaged spectra

