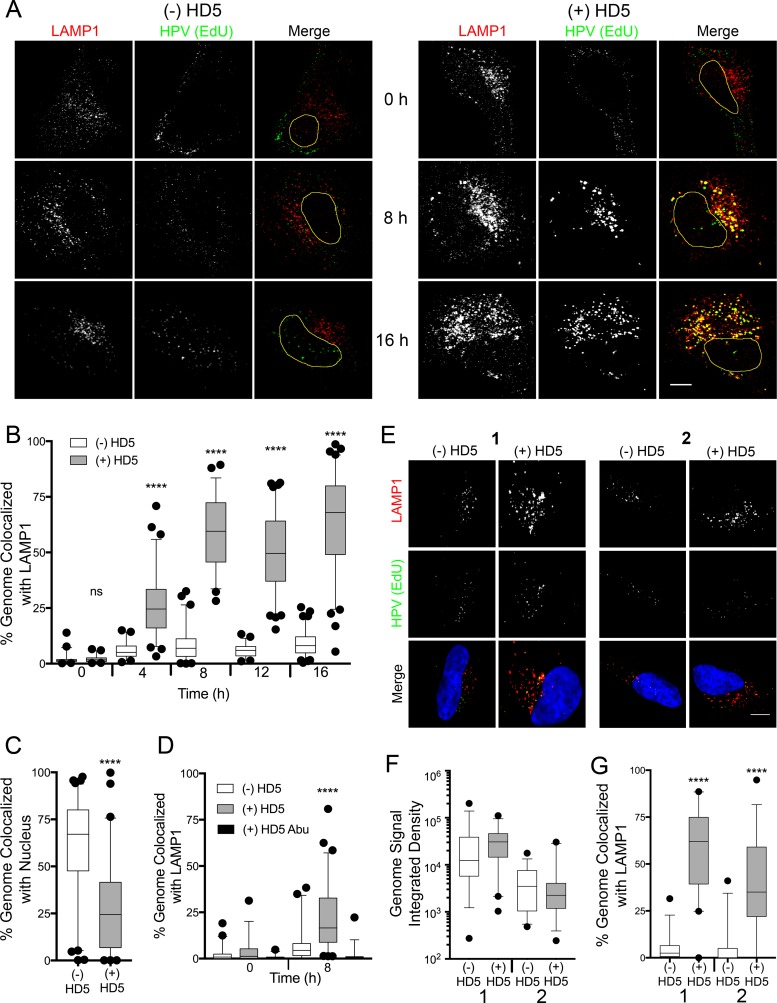
FIG 6 .
HD5 increases the lysosomal localization of the fcHPV16 genome. (A) Images of HeLa cells costained for LAMP1 and the fcHPV16 EdU genome at the indicated time points postinfection in the presence or absence of HD5. Individual panels depict signal above threshold for images in the z-stack that are coplanar with the nucleus for LAMP1 (red) and fcHPV16 genome (green). In the merged images, the nucleus is outlined in yellow. Bar, 10 µm. (B) Manders coefficient values M1 (genome colocalized with LAMP1) are plotted as a percentage for 40 to 60 HeLa cells for each condition. (C) HD5 blocks nuclear localization of the fcHPV16 genome. The percentage of genome pixels in the nucleus is plotted at 16 h postinfection for 40 to 60 cells. (D) Manders coefficient values M1 (genome colocalized with LAMP1) are plotted as a percentage for 40 to 60 HaCaT cells for each condition. (E) Images of paired HeLa cells costained for LAMP1 and fcHPV16 EdU genome at 8 h postinfection. (F) Integrated density of the EdU signal above threshold for 30 to 40 HeLa cells for each condition. (G) Manders coefficient values M1 (genome colocalized with LAMP1) are plotted as a percentage for 40 to 60 HeLa cells for each condition. For panels B, C, D, F, and G, whiskers are 5 to 95%, the horizontal line is the median, and outliers are depicted as individual points. ****, P < 0.0001, comparing HD5-treated cells to untreated cells in panels B, C, and G or HD5-treated cells to untreated and HD5 Abu-treated cells in panel D. All other comparisons are not significant.

