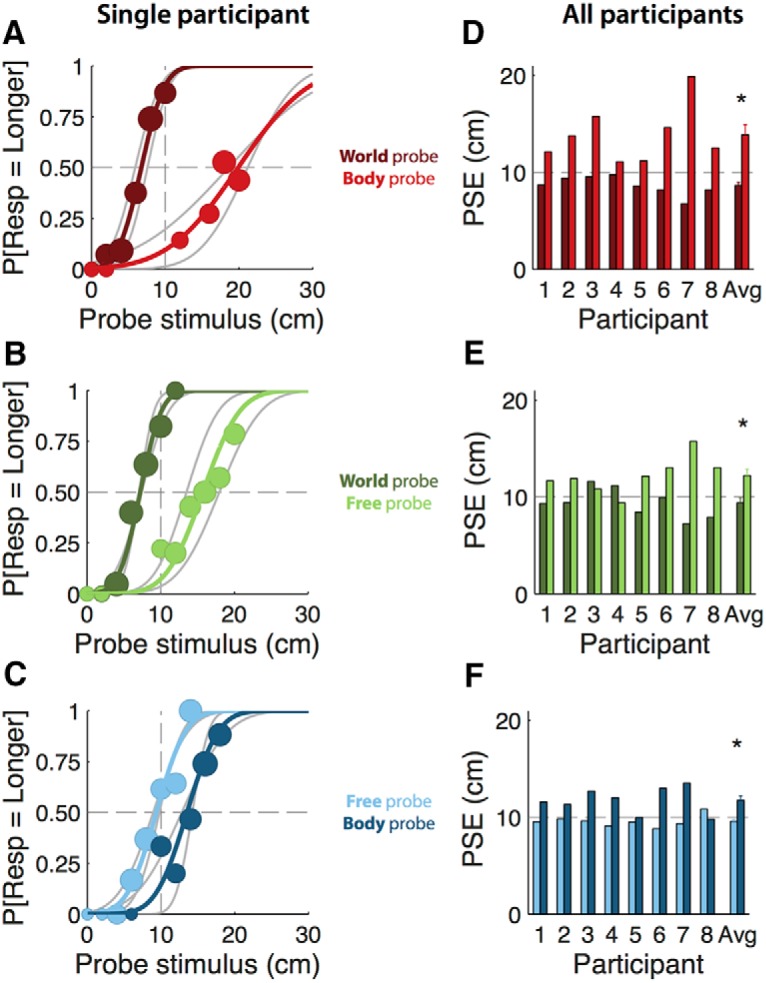
Figure 2.

A–C, Psychometric curves (colored lines) and associated binned data (circles) for participant number 7 (top row). Circle size represents the number of trials within each 2 cm bin. Binning was only performed in order to visualize this participant’s responses and was not used otherwise. Gray lines show psychometric curves before collapsing across reference order. Dashed gray lines represent the 10 cm reference movement. A, Body–world comparison; body reference, dark red; world reference, light red. B, World–free comparison; world reference, light green; free reference, dark green. C, Body–free comparison; body reference, dark blue; free reference, light blue. D–F, PSEs for all participants and the average ±SE (bottom row). Dashed gray lines represent the 10cm reference movement. Colors are as in A–C. D, Body–world comparison. E, World–free comparison. F, Body–free comparison. Because a t test revealed a main effect of reference order (t(47) = −5.2, p < 0.01), we used the mean PSE across reference order (e.g., colored lines) instead of the PSE without collapsing across reference order (e.g., gray lines); these values were not significantly different.
