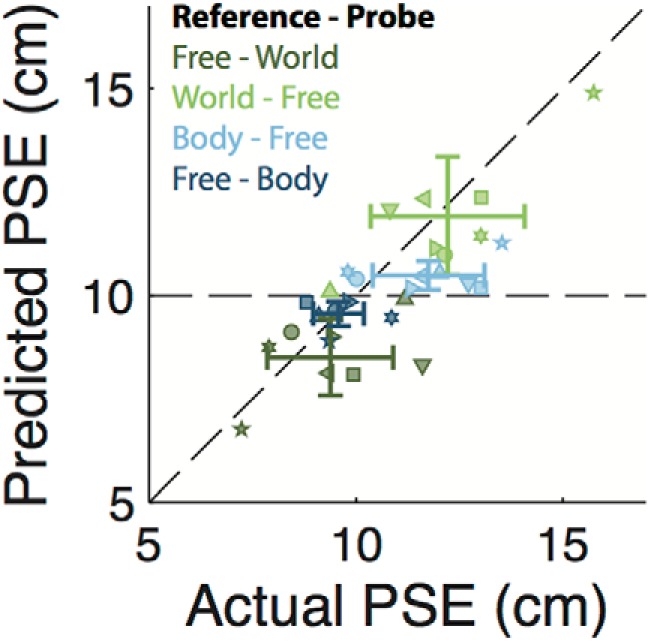
Figure 4.

Eye movement-based prediction for the PSE plotted against the actual PSE. A data point (symbol) is shown for each participant (symbol shape) and condition (symbol color) pair, following the same color scheme as in Figure 2. The identity line, corresponding to a perfect prediction, is shown in black.
